Rambus Inc.
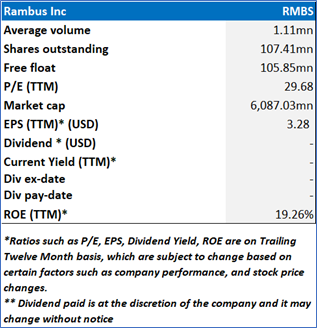
Rambus Inc. (NASDAQ: RMBS) develops chips, silicon intellectual property (IP), and advanced technologies designed to tackle key challenges in data acceleration and performance enhancement, particularly for data centers and other expanding markets. The company delivers a well-rounded and diversified range of solutions spanning semiconductor products, IP, and patent licensing.
As per our previous American Tech Report published on ‘RMBS’ on 29th April, 2025, Kalkine provided an ‘Buy’ stance on the stock at USD 50.11 based on fundamental analysis and the stock price has now moved by ~ 16.08% since then and is trading above resistance 2.
Noted below are the details of support and resistance levels provided in our previous report:
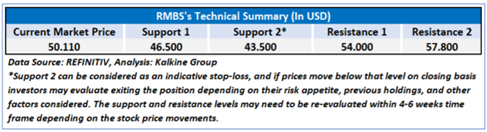
Rationale – Sell at USD 58.17
- Decline in Contract and Other Revenue: Rambus experienced a notable year-over-year decline in its contract and other revenue, which fell from $20.0 million in Q1 2024 to $16.4 million in Q1 2025. This drop, approximately 18%, suggests potential weaknesses in the company's ability to maintain or expand its service-related or custom engagement streams. While the company continues to perform strongly in product and royalty revenue, the decline in this area could indicate waning demand for customized or project-based engagements, which may limit diversification of revenue streams going forward.
- Rising Operating Expenses and Cost Structure: Despite its revenue growth, Rambus’s operating expenses increased from $64.1 million in Q1 2024 to $70.7 million in Q1 2025, reflecting a nearly 10% rise. This increase in expenses may put pressure on future profitability, particularly if revenue growth slows or fails to keep pace. Furthermore, while non-GAAP expenses remain more contained, the company still faces rising costs in key areas such as R&D and SG&A, which may impact margins if not carefully managed. The increase in cost of product revenue from $20.0 million to $30.6 million also reflects growing expenses tied to the company's expanding chip production operations.
- Dependence on Memory Interface Chips: Although Rambus delivered record product revenue primarily from DDR5 memory interface chips, this concentration exposes the company to risks associated with over-reliance on a specific product line. A slowdown in the adoption or demand for DDR5 technologies, competitive pressures, or supply chain disruptions could significantly affect future performance. Strategic diversification into other chip solutions or adjacent technologies will be critical to mitigate risks tied to market volatility in this product category.
- Guidance Implies Potential Growth Deceleration: While Rambus exceeded Q1 expectations, its Q2 2025 guidance signals more moderate growth. Licensing billings and royalty revenue are expected to decline sequentially compared to Q1, with royalty revenue guided between $67 million and $73 million versus $74 million in Q1. Licensing billings are also expected to dip to a range of $64 million to $70 million compared to Q1’s $73.3 million. This could suggest some softening demand or potential delays in closing licensing agreements, raising concerns about near-term momentum.
- Heavy Reliance on Operational Cash Flow for Capital Needs: The company’s solid cash position—boosted by $77.4 million in Q1 operational cash flow—was partly offset by $30.8 million in tax payments on restricted stock units and $7.9 million in capital expenditures. This reliance on operational cash flow to fund both shareholder-related obligations and investment in infrastructure may present risks if cash generation slows. Any disruption to Rambus’s high-margin licensing model or product demand could strain its ability to fund such outflows without dipping into its reserve or increasing debt.
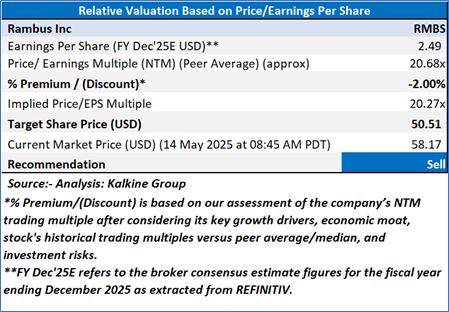
Valuation (Using P/E Methodology)
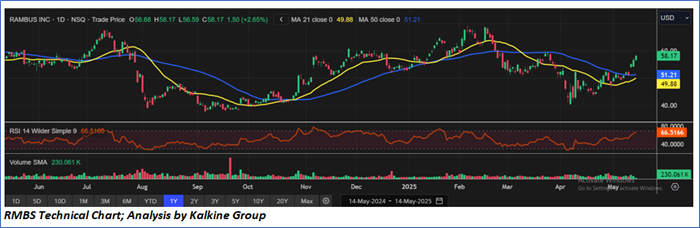
Share Price Chart
Conclusion
Despite strong top-line growth and record product revenue, Rambus faces several underlying challenges. The company saw a decline in contract and other revenue, rising operating expenses, and increasing cost of product revenue, all of which may pressure future margins. Its heavy reliance on DDR5 memory interface chips also heightens exposure to market volatility in that segment. Additionally, Q2 guidance implies a potential slowdown in licensing and royalty revenue, raising concerns about near-term growth momentum. These factors, combined with dependence on operational cash flow to cover taxes and capital needs, suggest vulnerabilities in Rambus’s financial and strategic positioning.
Based on the notional gains, valuation downside and price action stance, a "Sell" recommendation on Rambus Inc. (NASDAQ: RMBS) has been given at the current market price of USD 58.17 as on 14 May 2025 at 08:45 AM PDT.
Note 1: Past performance is not a reliable indicator of future performance.
Note 2: The reference date for all price data, currency, technical indicators, support, and resistance level is 14 May 2025. The reference data in this report has been partly sourced from REFINITIV.
Note 3: Investment decisions should be made depending on an individual's appetite for upside potential, risks, holding duration, and any previous holdings. An 'Exit' from the stock can be considered if the Target Price mentioned as per the Valuation and or the technical levels provided has been achieved and is subject to the factors discussed above.
Note 4: Target Price refers to a price level which the stock is expected to reach as per the relative valuation method and/or technical analysis taking into consideration both short-term and long-term scenario.
Note 5: ‘Kalkine reports are prepared based on the stock prices captured either from the London Stock Exchange (LSE) and or REFINITIV. Typically, both sources (LSE and or REFINITIV) may reflect stock prices with a delay which could be a lag of 15-20 minutes. There can be no assurance that future results or events will be consistent with the information provided in the report. The information is subject to change without any prior notice.’
Note 6: Dividend Yield may vary as per the stock price movement.

 Please wait processing your request...