FTC Solar, Inc.
FTC Solar, Inc. (NASDAQ: FTC) is a global leader in solar tracker systems, proprietary software, and engineering services. Headquartered in Austin, Texas, it serves customers worldwide with innovative products like the Voyager and Pioneer trackers and SunPath software. Founded in 2017, FTC Solar focuses on driving efficiency and cost savings in utility-scale solar projects.
Investment Summary
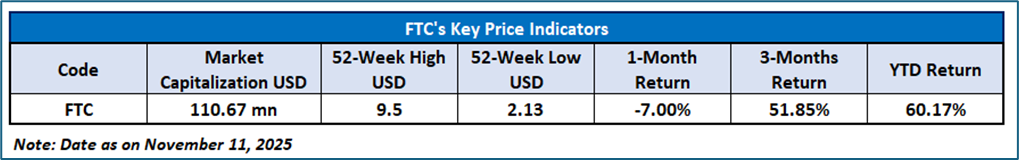
Revenue and Growth: FTC Solar reported robust third quarter revenue of $26.0 million, a 156.8% year-over-year increase, significantly exceeding guidance. Sequentially, revenue rose 30.2% to the highest in eight quarters, demonstrating a strong growth trajectory.
Profitability and Margins: The company achieved a positive non-GAAP gross margin of 7.7%, its first since late 2023, reflecting disciplined cost control and operational improvements. Adjusted EBITDA losses narrowed significantly to $4.0 million from $12.2 million a year prior, marking the best margin performance since 2020.
Strategic Developments: FTC Solar secured a $75 million strategic financing facility, closing $37.5 million in Q3. It announced a 1GW solar tracker supply deal with Levona Renewables, including a major Texas utility-scale project. The company also acquired full ownership of Alpha Steel, LLC, bolstering its manufacturing and domestic content capabilities.
Backlog and Innovation: The contracted backlog stands around $462 million, excluding the Levona agreement, indicating a strong project pipeline. Innovations like the Pioneer 1P tracker and SunPath software continue to optimize energy yields, enhancing competitive positioning in a growing market.
Outlook: FTC Solar projects approximately 25% revenue growth for Q4 2025 versus Q3, alongside further margin improvements. Leadership expresses confidence in sustained momentum, operational strength, and long-term growth prospects driven by product innovation and market expansion.
Technical Summary
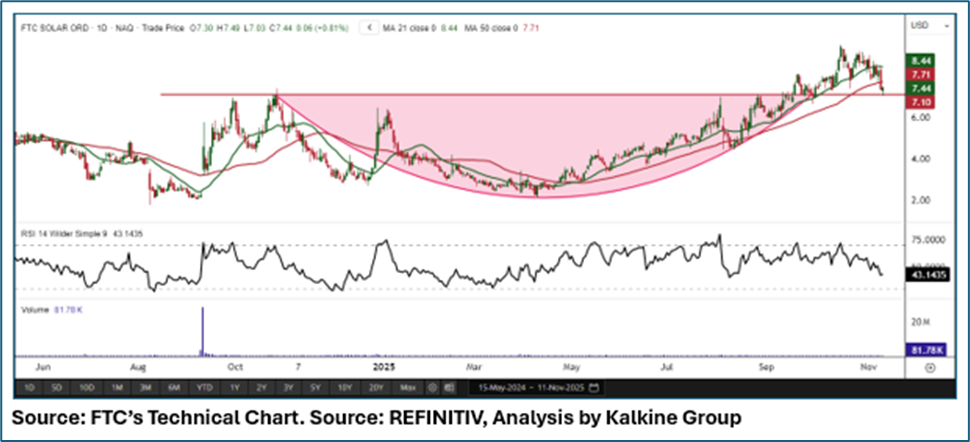
FTC Solar, Inc. is currently trading above its breakout support, following a large cup-and-handle pattern that developed through 2025. The stock has risen strongly, with the 50-day moving average ($ 7.71 ) and 21-day moving average ($ 8.44) showing bullish alignment. However, recent weakness is testing horizontal support near $7.10, a critical level following the breakout. Momentum, as measured by RSI at 43, is in the lower neutral range, signaling consolidation instead of strong upside. If $ 7.10 holds, the stock could rebound and retest highs above $8.50; a break below risks deeper correction. Overall, technicals remain constructive with a bullish longer-term bias, but near-term support must hold for continuation.
Conclusion
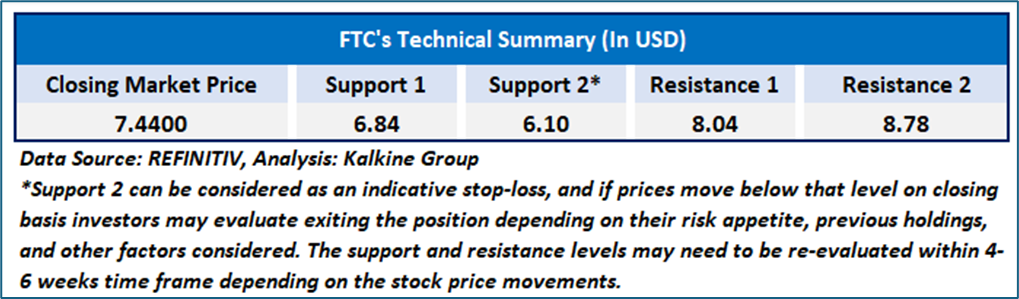
FTC Solar, Inc. demonstrated strong Q3 performance with a 156.8% revenue increase, positive gross margins, and narrowed EBITDA losses reflecting operational improvements. Strategic financing and acquisitions bolster its growth capacity, supported by a robust backlog. Technically, the stock shows bullish momentum with support at $7.10 critical for continuation. Overall, FTC Solar is well-positioned for revenue growth and margin expansion, combining financial strength with market and product innovation, making it an attractive investment in the renewable energy sector. Hence, based on the above rationale, we recommend a “Speculative Buy” recommendation at the closing price of USD 7.44 as of 11th November 2025.

Individuals can evaluate the stock based on the support and resistance levels provided in the report in case of keen interest taking into consideration the risk-reward scenario.
Markets are trading in a highly volatile zone currently due to certain macro-economic issues and prevailing geopolitical tensions. Therefore, it is prudent to follow a cautious approach while investing.
Related Risk: This report may be looked at from a high-risk perspective and a recommendation is provided for a short duration. This report is solely based on technical parameters, and the fundamental performance of the stocks has not been considered in the decision-making process. Other factors which could impact the stock prices include market risks, regulatory risks, interest rates risks, currency risks, social and political instability risks etc.
How to Read the Charts?
The green colour line reflects the 21-period simple moving average (SMA) while the red line indicates the 50- period simple moving average (SMA). SMA helps to identify existing price trends. If the prices are trading above the 21-period and 50-period moving average, then it shows prices are currently trading in a bullish trend.
The black colour line in the chart’s lower segment reflects the Relative Strength Index (14-Period) which indicates price momentum and signals momentum in trend. A reading of 70 or above suggests overbought status while a reading of 30 or below suggests an oversold status.
The blue colour bars in the chart’s lower segment show the volume of the stock. The volume is the number of shares that changed hands during a given day. Stocks with high volumes are more liquid than stocks with lesser volume as liquidity in stocks helps with easier and faster execution of the order.
The Orange colour lines are the trend lines drawn by connecting two or more price points and used for trend identification purposes. The trend line also acts as a line of support and resistance.
Technical Indicators Defined: -
Support: A level at which the stock prices tend to find support if they are falling, and a downtrend may take a pause backed by demand or buying interest. Support 1 refers to the nearby support level for the stock and if the price breaches the level, then Support 2 may act as the crucial support level for the stock.
Resistance: A level at which the stock prices tend to find resistance when they are rising, and an uptrend may take a pause due to profit booking or selling interest. Resistance 1 refers to the nearby resistance level for the stock and if the price surpasses the level, then Resistance 2 may act as the crucial resistance level for the stock.
Stop-loss: It is a level to protect further losses in case of unfavourable movement in the stock prices.
Past performance is neither an indicator nor a guarantee of future performance.
The reference date for all price data, currency, technical indicators, support, and resistance levels is of November 11, 2025. The reference data in this report has been partly sourced from REFINITIV.
Abbreviations
CMP: Current Market Price
SMA: Simple Moving Average
RSI: Relative Strength Index
USD: United States dollar
Note: Trading decisions require a thorough analysis by individual. Technical reports in general chart out metrics that may be assessed by individuals before any stock evaluation. The above are illustrative analytical factors used for evaluating stocks; other parameters can be looked at along with additional risks per se. Past performance is neither an indicator nor a guarantee of future performance.

 Please wait processing your request...