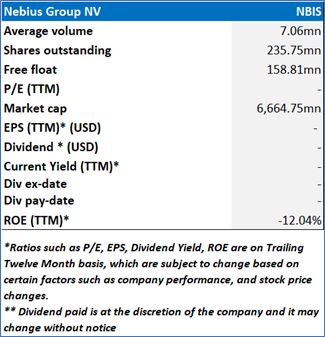
Nebius Group NV
Nebius Group NV (NASDAQ: NBIS) is a technology-focused infrastructure company based in the Netherlands. The company specializes in building a suite of artificial intelligence (AI) technologies and aims to become a key player in the AI ecosystem by integrating infrastructure, data, and advisory services on a global scale. Its offerings include a cloud platform designed for AI workloads, development services for autonomous vehicle technologies, and solutions for creating generative AI systems.
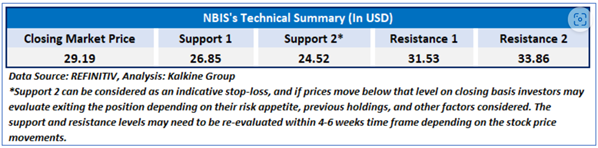
As per our previous US American Tech Report published on ‘NBIS’ on 25th March, 2025, Kalkine provided an ‘Buy’ stance on the stock at USD 29.19 based on fundamental analysis and the stock price has now moved by ~ 14.22% since then and is trading above resistance 1.
Noted below are the details of support and resistance levels provided in our previous report:
Rationale – Sell at USD 33.34
- Mounting Losses Despite Revenue Growth: Despite Nebius Group’s impressive revenue growth in Q4 and full-year 2024—466% and 462% year-over-year respectively—the company continues to post significant losses. The Q4 2024 net loss from continuing operations widened to USD 136.6 million from USD 88.3 million a year earlier, representing a 55% increase. For the full year, net loss increased to USD 396.9 million. These widening losses highlight the disconnect between topline expansion and the company's ability to achieve profitability, casting uncertainty on the scalability of its current business model.
- High Cash Burn and Capital Expenditures: Nebius Group’s operations and infrastructure expansion are heavily cash-intensive. In Q4 2024 alone, the company reported a cash outflow from operations of USD 80.4 million, contributing to a full-year operational outflow of USD 319.6 million. Additionally, capital expenditures stood at USD 417.6 million for Q4 and USD 808.1 million for the full year. While these investments are intended to support long-term growth, the high burn rate raises concerns about sustainability, especially in the absence of profitability.
- Missed ARR Targets Reflect Execution Risks: While management emphasized future growth potential, Nebius missed its own ARR guidance for December 2024, reaching only USD 90 million versus prior expectations. This shortfall was attributed to delays in customer onboarding and migration challenges related to its new AI-cloud platform. The underperformance highlights execution risks in scaling the business and integrating new technologies, particularly when foundational sales and marketing functions are still being built out.
- Adjusted Financial Metrics Still Show Weakness: Even on an adjusted basis, Nebius Group's financial results reflect limited improvement. Adjusted EBITDA loss narrowed slightly in Q4 (by 7% YoY) to USD 75.5 million, and the full-year figure remained steep at USD 266.4 million. Similarly, the adjusted net loss in Q4 stayed elevated at USD 87.5 million. These figures suggest that the core business remains structurally unprofitable, despite normalization attempts through non-GAAP metrics, underlining ongoing operational inefficiencies or high fixed costs.
- Dependency on External Financing and Investor Confidence: The company’s operations are currently supported by significant external funding, including a USD 700 million capital raise in December 2024. While this funding reflects investor confidence, continued reliance on such inflows presents a vulnerability—especially if investor sentiment changes or capital markets tighten. Without a clear path to self-sustaining cash flow, future funding rounds may become increasingly dilutive or costly.
- Competitive and Regulatory Challenges in Emerging Verticals: Nebius Group operates in highly competitive and rapidly evolving sectors such as AI infrastructure, autonomous vehicles, and edtech. Each business unit faces significant barriers—from technological differentiation to regulatory approval. For instance, while Avride made headway in global markets, including Japan and South Korea, scaling operations across geographies could introduce regulatory delays and compliance costs. Similarly, Toloka and TripleTen must contend with fierce competition from established global players, which could hinder market share growth and pricing power.
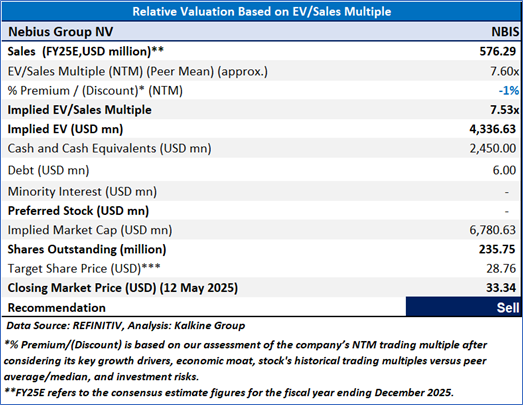
Valuation (Using EV/Sales Methodology)
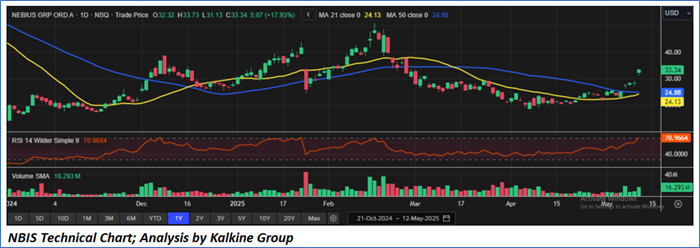
Share Price Chart
Conclusion
Despite Nebius Group’s impressive revenue growth, the company remains deeply unprofitable, with mounting net losses and a high cash burn driven by aggressive capital expenditures. It missed key performance targets such as ARR guidance, highlighting execution risks, while adjusted financial metrics still show substantial losses. The business is heavily reliant on external funding to sustain operations, and its expansion into highly competitive, regulation-heavy sectors adds further uncertainty to its path toward profitability.
Based on the notional gains, valuation downside and price action stance, a "Sell" recommendation on Nebius Group NV (NASDAQ: NBIS) has been given at the closing market price of USD 33.34 as on 12 May 2025.
Note 1: Past performance is not a reliable indicator of future performance.
Note 2: The reference date for all price data, currency, technical indicators, support, and resistance level is 12 May 2025. The reference data in this report has been partly sourced from REFINITIV.
Note 3: Investment decisions should be made depending on an individual's appetite for upside potential, risks, holding duration, and any previous holdings. An 'Exit' from the stock can be considered if the Target Price mentioned as per the Valuation and or the technical levels provided has been achieved and is subject to the factors discussed above.
Note 4: Target Price refers to a price level which the stock is expected to reach as per the relative valuation method and/or technical analysis taking into consideration both short-term and long-term scenario.
Note 5: ‘Kalkine reports are prepared based on the stock prices captured either from the London Stock Exchange (LSE) and or REFINITIV. Typically, both sources (LSE and or REFINITIV) may reflect stock prices with a delay which could be a lag of 15-20 minutes. There can be no assurance that future results or events will be consistent with the information provided in the report. The information is subject to change without any prior notice.’
Note 6: Dividend Yield may vary as per the stock price movement.

 Please wait processing your request...