Citigroup Inc
Citigroup Inc. (NYSE: C) is a diversified financial services holding company. Its segments include Services, Markets, Banking, U.S. Personal Banking (USPB) and Wealth. Services segment includes treasury and trade solutions (TTS) and securities services.
Recent Business and Financial Updates
- Revenue Performance: In the second quarter of 2024, Citigroup Inc. reported revenues of USD 20.1 billion, reflecting a 4% increase compared to the same period in the previous year. When excluding the impacts related to divestitures, the revenue growth stands at 3%. This growth was driven by strong performance across various business segments, including Banking, U.S. Personal Banking (USPB), and Markets. A notable contributor to this increase was an approximately USD 400 million gain from the Visa B exchange completed in the second quarter of 2024. This gain was primarily reflected in the Markets segment, with the remaining amount categorized under All Other. Despite this growth, there was a partial offset due to a decline in the All-Other segment.
- Net Income and Earnings Per Share: Citigroup's net income for the second quarter of 2024 was USD 3.2 billion, up from USD 2.9 billion in the same quarter of the previous year. This increase in net income is attributed to higher revenues and lower operating expenses, although it was partially offset by an increased cost of credit. The earnings per share (EPS) also saw an improvement, rising to USD 1.52 from USD 1.33 per diluted share in the prior-year period. This rise in EPS reflects the higher net income and a slight decrease in the average diluted shares outstanding.
- Operating Expenses: Operating expenses for the second quarter of 2024 amounted to USD 13.4 billion, representing a 2% decrease compared to the same period in the previous year. This decrease in expenses was observed both on a reported basis and when excluding divestiture-related impacts. The reduction in operating expenses was primarily due to the bank's ongoing simplification efforts, stranded cost reductions, and lower repositioning costs. However, these savings were partially offset by continued investments in transformation and the civil money penalties imposed by the Federal Reserve Board (FRB) and the Office of the Comptroller of the Currency (OCC).
- Cost of Credit and Allowance for Credit Losses: The cost of credit for Citigroup in the second quarter of 2024 was approximately USD 2.5 billion, compared to USD 1.8 billion in the previous year. This increase was mainly driven by higher net credit losses in the cards segment, although it was partially offset by a lower allowance for credit losses (ACL) build in the current period. The total allowance for credit losses at the end of the quarter was approximately USD 21.8 billion, up from USD 20.1 billion at the end of the prior-year period. The reserve-to-funded loans ratio was 2.68%, slightly higher than the 2.67% recorded at the end of the previous year.
- Capital Ratios and Shareholder Returns: Citigroup maintained a robust Common Equity Tier 1 (CET1) Capital ratio of 13.6% at the end of the second quarter of 2024, an improvement from 13.5% at the end of the previous quarter. This increase was driven by net income and lower risk-weighted assets, partially offset by the payment of common and preferred dividends and the impact of USD appreciation. Additionally, Citigroup returned approximately USD 1.0 billion to common shareholders in the form of dividends during the quarter, representing a payout ratio of 34%.
- Book Value and Deposits: The book value per share at the end of the second quarter of 2024 was USD 99.70, reflecting a 2% increase from the previous year. The tangible book value per share was USD 87.53, representing a 3% increase over the same period. These increases were largely driven by net income, partially offset by the payment of dividends and adverse movements in the accumulated other comprehensive income component of equity. The end-of-period deposits were approximately USD 1.3 trillion, a 3% decrease from the prior-year period, largely due to a reduction in Treasury and Trade Solutions, reflecting quantitative tightening.
Technical Observation (on the daily chart):
The Relative Strength Index (RSI) over a 14-day period stands at a value of 30.36, nearing oversold zone and downward trending, with the price near next important support range of USD50-USD55, with expectations of upward trend in case those support levels holds. Additionally, the stock's current positioning is between both 50-Day SMA and 200-Day SMA, which can act as a short to medium term resistance and support levels respectively.

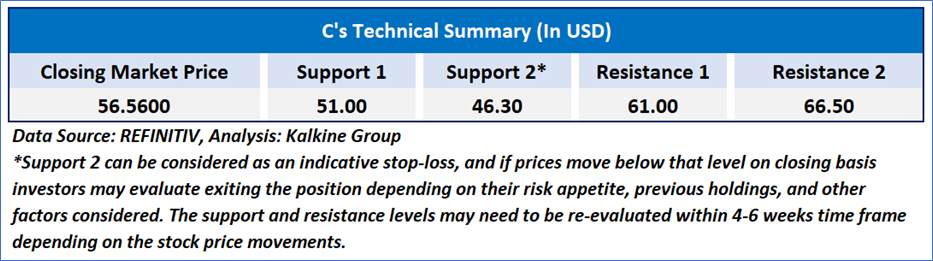
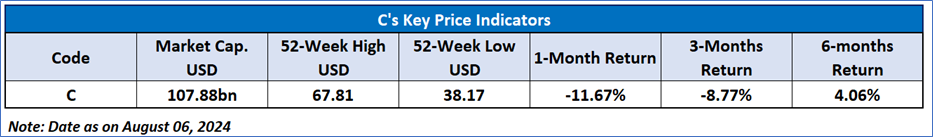
As per the above-mentioned price action, recent key business and financial updates, momentum in the stock over the last month, and technical indicators analysis, a ‘Buy’ rating has been given to Citigroup Inc. (NYSE: C) at the closing market price of USD 56.56 as of August 06, 2024.
Individuals can evaluate the stock based on the support and resistance levels provided in the report in case of keen interest taking into consideration the risk-reward scenario.
Markets are trading in a highly volatile zone currently due to certain macro-economic issues and prevailing geopolitical tensions. Therefore, it is prudent to follow a cautious approach while investing.
Related Risk: This report may be looked at from a high-risk perspective and a recommendation is provided for a short duration. This report is solely based on technical parameters, and the fundamental performance of the stocks has not been considered in the decision-making process. Other factors which could impact the stock prices include market risks, regulatory risks, interest rates risks, currency risks, social and political instability risks etc.
Note 1: Past performance is not a reliable indicator of future performance.
Note 2: The reference date for all price data, currency, technical indicators, support, and resistance level is August 06, 2024. The reference data in this report has been partly sourced from REFINITIV.
Note 3: Investment decisions should be made depending on an individual's appetite for upside potential, risks, holding duration, and any previous holdings. An 'Exit' from the stock can be considered if the Target Price mentioned as per the Valuation and or the technical levels provided has been achieved and is subject to the factors discussed above.
Note 4: Target Price refers to a price level that the stock is expected to reach as per the relative valuation method and or technical analysis taking into consideration both short-term and long-term scenarios.s
Note 5: ‘Kalkine reports are prepared based on the stock prices captured either from the New York Stock Exchange (NYSE), NASDAQ Capital Markets (NASDAQ), and or REFINITIV. Typically, all sources (NYSE, NASDAQ, or REFINITIV) may reflect stock prices with a delay which could be a lag of 15-20 minutes. There can be no assurance that future results or events will be consistent with the information provided in the report. The information is subject to change without any prior notice.

 Please wait processing your request...