MP Materials Corp (NYSE: MP)
MP Materials Corp is a producer of specialty materials that are prominent inputs for electrification and other advanced technologies. Company employs an ownership and operation of the Mountain Pass Rare Earth Mine in North America.
Recommendation Rationale – SELL at USD 15.49
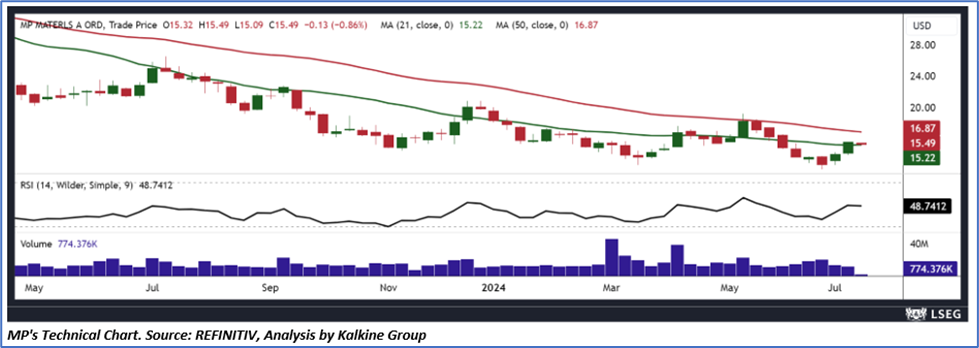
- Trading around Resistance: MP’s share price has breached the R1 level as suggested in the previous report published on 3rd July 2024. Therefore, there can be a possible decline from the resistance levels given the market conditions.
- Overvalued Multiples: On a forward 12-month basis – key trading multiples (EV/EBITDA, Price/Earnings, EV/Sales, and Price/Cash Flow) are higher than the median of metals & Mining sector.
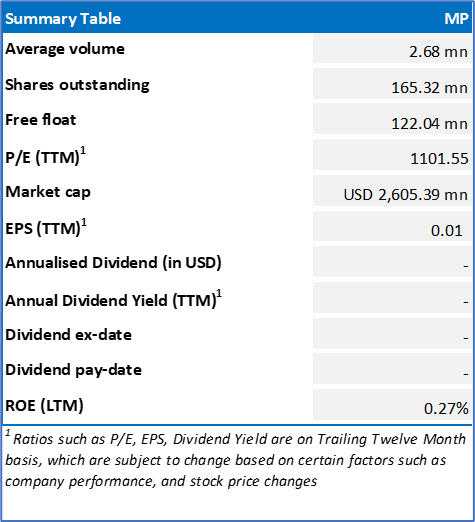
- Declining Revenue: MP’s revenue has declined y-o-y by 49.13% to USD 48.68 mn in Q1 FY24, compared to USD 95.70 mn in Q1 FY23. Incidentally, the gross profit was recorded at USD 13.09 mn in Q1 FY24, down by 81.69% from USD 95.60 mn in Q1 FY23.
- Heightened Debt: As compared to industry’s median, MP is employing more debt financing than equity financing to source their capital assets, thereby escalating their credit risk exposure. Debt-to-equity ratio of MP is 0.83x in Q1 FY24, compared to industry median of 0.21x.
- Market Risks: Macroeconomic Risk: The market sentiments can remain weak in the short-term due to the subdued consumer disposable income, geopolitical tensions, and political risks.
MP’s Daily Price Chart
Valuation Methodology: Price/Earnings Approach (FY Dec'25E) (Illustrative)
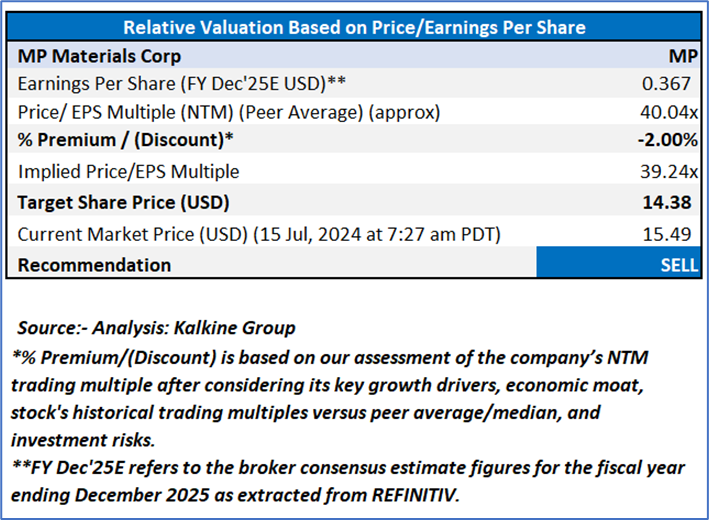
MP is expected to trade at a discount considering its lowering gross profit, depleting y-o-y revenue in Q1 FY24 and higher cash cycle. For conducting the valuation, the following peers have been considered:
Royal Gold Inc (NASDAQ: RGLD), Century Aluminum Company (NASDAQ: CENX), Algoma Steel Group Inc (NASDAQ: ASTL), and others.
Given its current trading levels, declining revenues, relative valuation, and risks associated, it is prudent to book profit at the current levels. Hence, a ‘Sell’ recommendation is given on the stock at the current market price of USD 15.49, as of 15 July 2024 at 7:27 am PDT.
MP Materials Corp (NYSE: MP) is a part of Global Green Energy Report
Markets are trading in a highly volatile zone currently due to certain macro-economic issues and geopolitical issues prevailing geopolitical tensions. Therefore, it is prudent to follow a cautious approach while investing.
Note 1: Past performance is neither an indicator nor a guarantee of future performance.
Note 2: The reference date for all price data, currency, technical indicators, support, and resistance levels is 15 July 2024. The reference data in this report has been partly sourced from REFINITIV.
Note 3: Investment decisions should be made depending on an individual's appetite for upside potential, risks, holding duration, and any previous holdings. An 'Exit' from the stock can be considered if the Target Price mentioned as per the Valuation and or the technical levels provided has been achieved and is subject to the factors discussed above.
Note 4: ‘Kalkine reports are prepared based on the stock prices captured either from the New York Stock Exchange (NYSE), NASDAQ Capital Markets (NASDAQ), and or REFINITIV. Typically, all sources (NYSE, NASDAQ, or REFINITIV) may reflect stock prices with a delay which could be a lag of 15-20 minutes. There can be no assurance that future results or events will be consistent with the information provided in the report. The information is subject to change without any prior notice.’
Technical Indicators Defined: -
Support: A level at which the stock prices tend to find support if they are falling, and downtrend may take a pause backed by demand or buying interest.
Resistance: A level at which the stock prices tend to find resistance when they are rising, and uptrend may take a pause due to profit booking or selling interest.
Stop-loss: In general, it is a level to protect further losses in case of any unfavourable movement in the stock prices.

 Please wait processing your request...