Centuria Office REIT (ASX: COF)
Centuria Office REIT (ASX: COF) is an ASX-listed pure play office REIT. COF owns a portfolio of office assets situated in core submarkets throughout Australia. It provides investors with income and the opportunity for capital growth from a pure play portfolio of high-quality Australian office assets.
Recommendation Rationale – SELL at AUD 1.175
- Impact of Remote Working Trends: The ongoing rise of remote and hybrid working arrangements could decrease demand for traditional office space. If this trend accelerates, COF may face challenges in maintaining high occupancy rates across its office portfolio, affecting rental income and asset values.
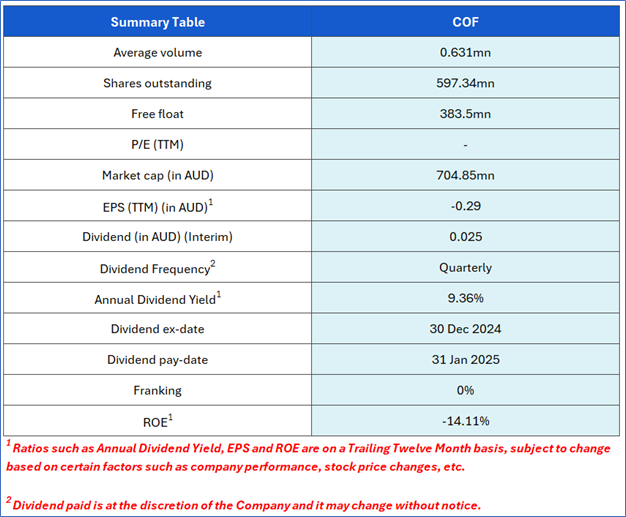
- Widened Losses: COF reported a net loss of AUD 168.7mn for FY24 ended 30 June 2024, compared to a net loss of AUD 91.9mn in FY23. Funds from Operations also decreased to AUD 82.2mn in FY24 from AUD 93.0mn in FY23.
- Lower Guidance: The company has provided FY25 Funds from Operations guidance of 11.8 cents per unit (cpu) and distribution guidance of 10.1 cents per unit. This compares to 13.8 cents per unit for Funds from Operations and 12.0 cents per unit for distribution in FY24.
- Emerging Risks: COF faces risks from fluctuating office demand, potential rent reductions, economic downturns affecting occupancy rates, interest rate hikes impacting borrowing costs, and regulatory changes in the real estate sector.
COF Daily Chart
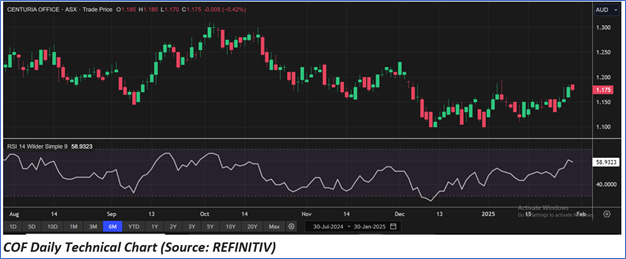
Given its widened losses in FY24, lower FY25 guidance, current trading levels, market uncertainties, and risks associated, the share price can witness resistance at the current levels. Hence, a ‘Sell’ recommendation is given on the stock at the closing market price of AUD 1.175, as of 30 January 2025.
Markets are trading in a highly volatile zone currently due to certain macro-economic issues and geopolitical issues prevailing geopolitical tensions. Therefore, it is prudent to follow a cautious approach while investing.
Note 1: Past performance is neither an indicator nor a guarantee of future performance.
Note 2: The reference date for all price data, currency, technical indicators, support, and resistance levels is 30 January 2025. The reference data in this report has been partly sourced from REFINITIV.
Note 3: Investment decisions should be made depending on an individual's appetite for upside potential, risks, holding duration, and any previous holdings. An 'Exit' from the stock can be considered if the Target Price mentioned as per the Valuation and or the technical levels provided has been achieved and is subject to the factors discussed above.
Note 4: Dividend Yield may vary as per the stock price movement.
Note 5: Kalkine reports are prepared based on the stock prices captured either from REFINITIV or Trading View. Typically, REFINITIV or Trading View may reflect stock prices with a delay which could be a lag of 25-30 minutes. There can be no assurance that future results or events will be consistent with the information provided in the report. The information is subject to change without any prior notice.
Technical Indicators Defined: -
Support: A level at which the stock prices tend to find support if they are falling, and a downtrend may take a pause backed by demand or buying interest. Support 1 refers to the nearby support level for the stock and if the price breaches the level, then Support 2 may act as the crucial support level for the stock.
Resistance: A level at which the stock prices tend to find resistance when they are rising, and an uptrend may take a pause due to profit booking or selling interest. Resistance 1 refers to the nearby resistance level for the stock and if the price surpasses the level, then Resistance 2 may act as the crucial resistance level for the stock.
Stop-loss: It is a level to protect further losses in case of unfavourable movement in the stock prices.

 Please wait processing your request...