This report is an updated version of the report published on 11 March 2025, at 9:05 AM PST.
Clearway Energy, Inc. (NYSE: CWEN)
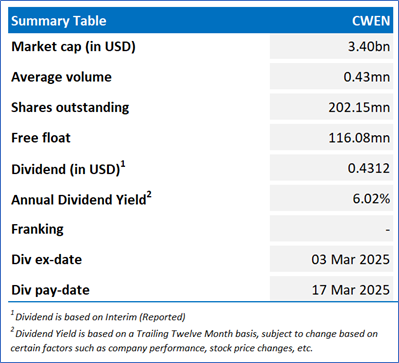
CWEN is a renewable energy company. It invests in energy infrastructures and focuses on investments in clean energy and owns modern, sustainable and long-term contracted assets across North America. Its businesses are segregated based on conventional power generation and renewable businesses, which consist of solar, wind and energy storage.
Recommendation Rationale – SELL at USD 29.0
- Financial Highlights: CWEN’s operating income dropped to USD 196mn in FY24 compared to USD 263mn in FY23. The company recorded a net loss of USD 63mn in FY24, up from USD 14mn in FY23. The increase in net loss was mainly attributed to higher depreciation and amortization resulting from growth investments, as well as fluctuations in the mark-to-market value of economic hedges.
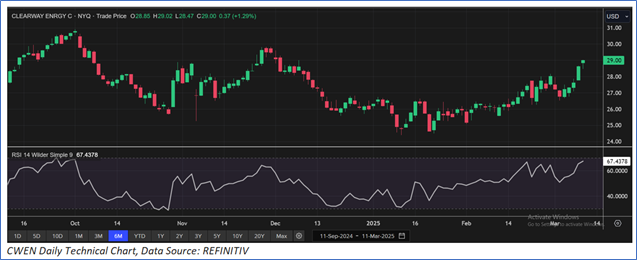
- Trading Near the Resistance: CWEN stock has surpassed its R1 level recommended on 08 January 2025. Therefore, share price can face resistance at the current levels.
- Overvalued Multiples: On a forward 12-month basis – key trading multiples (EV/Sales, Price/Earnings, Price/Book) are higher than the median of Utilities sector.
- Market Risk: Changes in government policies, regulations, and incentives related to renewable energy could impact CWEN's operations and profitability. This includes potential changes in tax credits, environmental regulations, and energy policies.
CWEN’s Daily Price Chart
Valuation Methodology: EV/Sales Approach (FY December'25E) (Illustrative)
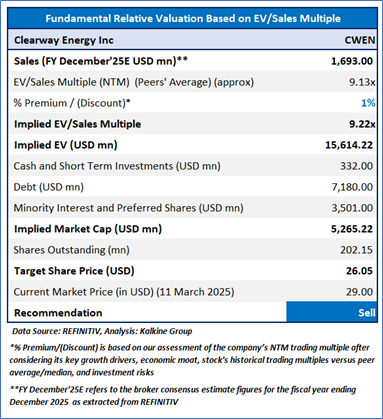
Stock might trade at a slight premium to its peers considering the operating revenues growth in FY24, increased adjusted EBITDA in FY24, expected cash from operating activities in FY25, and anticipated adjusted EBITDA in FY25. For conducting the valuation, the following peers have been considered: Altus Power Inc (NYSE: AMPS), York Water Co (NASDAQ: YORW), and Nextera Energy Inc (NYSE: NEE) have been considered.
Considering that the stock has surpassed its R1 level, rally in share price, current trading level, and risks associated, the share price can face consolidation at the current levels. Hence, a ‘Sell’ recommendation is given on the stock at the current market price of USD 29.00, as of 11 March 2025 at 07:45 AM PST.
Clearway Energy, Inc. (NYSE: CWEN) is a part of Global Green Energy Portfolio.
Markets are trading in a highly volatile zone currently due to certain macro-economic issues and geopolitical issues prevailing geopolitical tensions. Therefore, it is prudent to follow a cautious approach while investing.
Note 1: Past performance is neither an indicator nor a guarantee of future performance.
Note 2: The reference date for all price data, currency, technical indicators, support, and resistance levels is 11 March 2025. The reference data in this report has been partly sourced from REFINITIV.
Note 3: Investment decisions should be made depending on an individual's appetite for upside potential, risks, holding duration, and any previous holdings. An 'Exit' from the stock can be considered if the Target Price mentioned as per the Valuation and or the technical levels provided has been achieved and is subject to the factors discussed above.
Note 4: Dividend Yield may vary as per the stock price movement.
Note 5: Kalkine reports are prepared based on the stock prices captured either from REFINITIV or Trading View. Typically, REFINITIV or Trading View may reflect stock prices with a delay which could be a lag of 25-30 minutes. There can be no assurance that future results or events will be consistent with the information provided in the report. The information is subject to change without any prior notice.
Technical Indicators Defined: -
Support: A level at which the stock prices tend to find support if they are falling, and downtrend may take a pause backed by demand or buying interest.
Resistance: A level at which the stock prices tend to find resistance when they are rising, and uptrend may take a pause due to profit booking or selling interest.
Stop-loss: In general, it is a level to protect further losses in case of any unfavourable movement in the stock prices.

 Please wait processing your request...