This report is an updated version of the report published on 12 February 2025 at 12:50 PM AEDT.
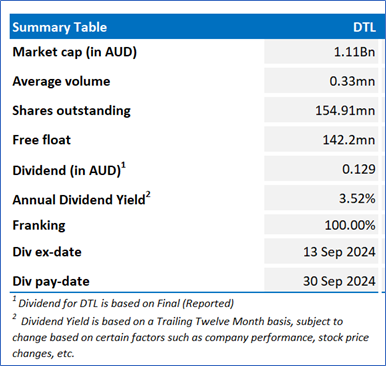
Data#3 Limited (ASX: DTL)
Data#3 Limited (ASX: DTL) is an information technology (IT) services and solutions provider. It is focused on helping customers solve complex business challenges using technology solutions.
Recommendation Rationale – SELL at AUD 7.41
- Overvalued Multiples: On a forward 12-month basis, the stock is trading at a Price/Cash Flow multiple of 28.5x vs industry (Technology) median of 15.2x.
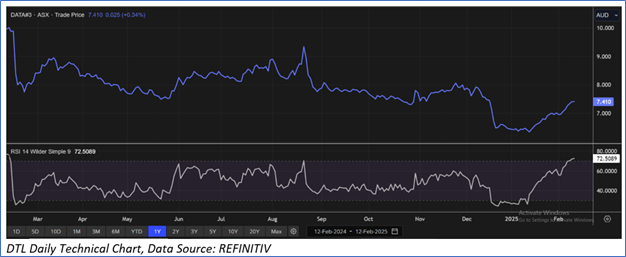
- Trading Around Resistance:DTL’s share price surpassed its R1 level recommended on 02 January 2025.
- Decline in Cash Balance: At the end of 30 June 2024, the company reported a cash balance of AUD 276.4mn, down from AUD 404.8mn as at 30 June 2023. Net cash outflow from operating activities in FY24 stood at AUD 86.2mn as compared to net cash inflows of AUD 291mn in FY23.
- Emerging Risks: DTL operates in the technology sector, which can be volatile. Market fluctuations, technological advancements, and shifts in investor sentiment can all impact stock prices. Additionally, the company faces competition from other cloud networking firms as well as traditional telecommunications providers.
DTL Daily Chart
Valuation Methodology: P/E Approach (FY June'25E) (Illustrative)
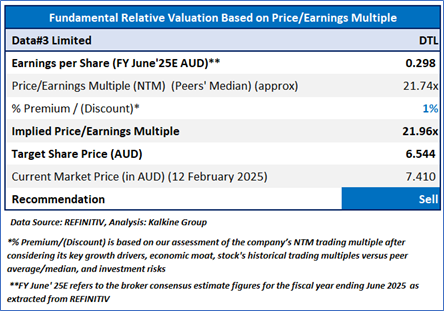
Considering the ongoing investments in enterprise security, and digital transformation, increase in sales of Products (both Software and Infrastructure Solutions) in FY24, expanded gross margins, rise in bottom line, etc., the company might trade at a slight premium to its peers. For valuation, few peers like Macquarie Technology Group Ltd (ASX: MAQ), Readytech Holdings Ltd (ASX: RDY), Iress Ltd (ASX: IRE), and others have been considered. Considering that the stock is approaching its R2 level, rally in share price, current trading level, and risks associated, the share price can face consolidation at the current levels. Hence, a ‘Sell’ recommendation is given on the stock at the current price of AUD 7.41 (as of 12 Februrauy 2025, at 11:10 AM AEDT).
Note: This report may be updated with details around fundamental and technical analysis, price/ chart in due course, as appropriate.
Note 1: Past performance is neither an indicator nor a guarantee of future performance.
Note 2: The reference date for all price data, currency, technical indicators, support, and resistance levels is 12 February 2025. The reference data in this report has been partly sourced from REFINITIV.
Note 3: Investment decisions should be made depending on an individual's appetite for upside potential, risks, holding duration, and any previous holdings. An 'Exit' from the stock can be considered if the Target Price mentioned as per the Valuation and or the technical levels provided has been achieved and is subject to the factors discussed above.
Note 4: Dividend Yield may vary as per the stock price movement.
Note 5: Kalkine reports are prepared based on the stock prices captured either from REFINITIV or Trading View. Typically, REFINITIV or Trading View may reflect stock prices with a delay which could be a lag of 25-30 minutes. There can be no assurance that future results or events will be consistent with the information provided in the report. The information is subject to change without any prior notice.
Technical Indicators Defined: -
Support: A level at which the stock prices tend to find support if they are falling, and a downtrend may take a pause backed by demand or buying interest. Support 1 refers to the nearby support level for the stock and if the price breaches the level, then Support 2 may act as the crucial support level for the stock.
Resistance: A level at which the stock prices tend to find resistance when they are rising, and an uptrend may take a pause due to profit booking or selling interest. Resistance 1 refers to the nearby resistance level for the stock and if the price surpasses the level, then Resistance 2 may act as the crucial resistance level for the stock.
Stop-loss: It is a level to protect further losses in case of unfavourable movement in the stock prices.

 Please wait processing your request...