Canadian Solar Inc.
CSIQ Details
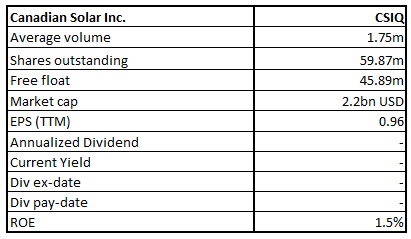
Canadian Solar Inc (NASDAQ: CSIQ) is a leading solar technology and renewable energy company. The company has a market capitalisation of ~$2.2 billion as on 25th May 2021.
Q4 FY 2020 Performance
The company’s total module shipments rose 21% YoY in Q4 as well as reached full year 2020 shipments of 11.3 GW, which happens to be the highest in the company’s record. Notably, ASPs in Q4 witnessed a slight increase sequentially, which partly offsets the significant rise in the input costs.

Financial Snapshot (Source: Company Reports)
Q1FY21 Result Update (For the Quarter Ended March 31, 2021)
The company has logged a 32% YoY rise in revenue to $1.1 billion as compared to guidance of $1.0 billion to $1.1 billion and total module shipments increased by 42% YoY to 3,139 MW. It achieved a gross margin of 17.9% as compared to 13.6% in Q4FY20 mainly led by increased contribution of high margin project sales and higher module ASP. This was partly offset by higher manufacturing costs.
Outlook
CSIQ reiterated FY21 guidance and total module shipment is expected to remain in the range of 18 GW to 20 GW and project sales is expected to stay between 1.8 GW to 2.3 GW. It introduced 2021 total battery storage shipment guidance of 810 MWh- 860 MWh. Notably, total revenue for 2021 is expected to be between $5.6 billion to $6.0 billion. On 13th May 2021, the company announced that it executed the strategic partnership as well as investment with Habitat Energy.
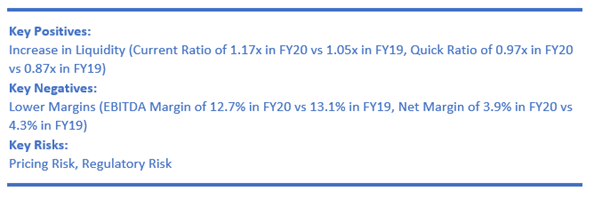
Key Risks
The company is witnessing cost inflation due to sustained higher raw material and transportation costs, and unfavourable foreign exchange fluctuations. The price of polysilicon has tripled over the past twelve months.
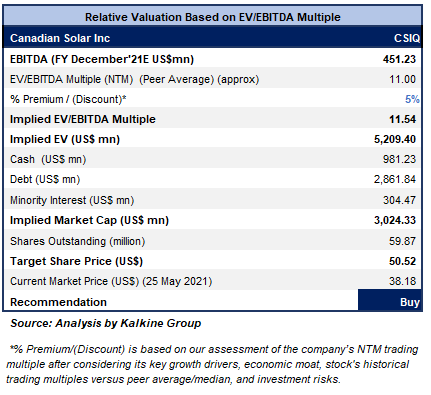
Valuation Methodology: EV/EBITDA Multiple Based Relative Valuation (Illustrative)
Technical Overview:
Weekly Chart –
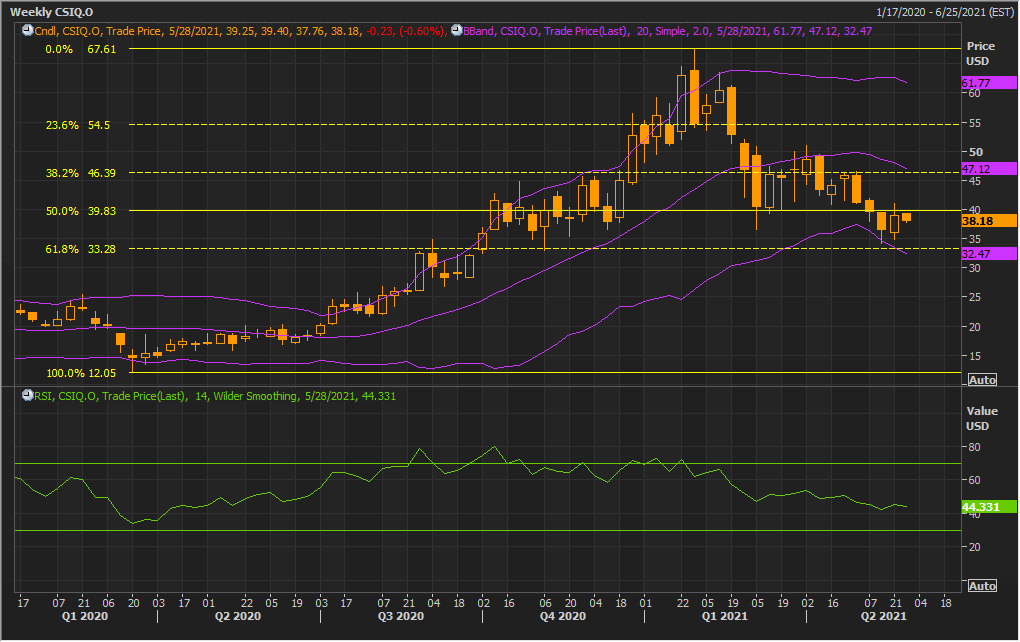
Source: Refinitiv (Thomson Reuters)
Note: Purple colour lines are Bollinger Bands® with the upper band suggesting overbought status while the lower band oversold status, and yellow lines are Fibonacci retracement lines which measure price rebound and backtrack. https://www.bollingerbands.com/
The stock was in a downtrend but reversing trend, it gave a stronger closing for the previous week. However, the stock has given a softer close at $38.18 for the ongoing week, it is still towards the continuation of the uptrend. The technical indicator RSI with a reading around 44, suggests neutral momentum for the stock.
Going forward, the stock may have resistance around the converging point of a 38.2% retracement level and 20 periods SMA of $46.39 whereas support could be around $36.00.
Stock Recommendation
The stock rose by ~37.7% in 9 months. It has made a 52-week low and high of $16.82 and $67.39, respectively. We have valued the stock using an EV/EBITDA multiple-based illustrative relative valuation and have arrived at a target price that reflects a rise of low double-digit (in % terms). We have assigned a premium to EV/EBITDA Multiple (NTM) (Peer Average) considering continued strong underlying demand for solar energy and decent business performance in Q1FY21.
For the purpose of relative valuation, we have taken peers like Cirrus Logic Inc (CRUS.OQ), Cohu Inc (COHU.OQ), Diodes Inc (DIOD.OQ), to name a few.
Thus, we give a “Buy” recommendation on the stock at the current market price of $38.18 per share, down by 0.6% on 25th May 2021.
Note 1: The reference data in this report has been partly sourced from REFINITIV.
Note 2: Investment decisions should be made depending on the investors’ appetite on upside potential, risks, holding duration, and any previous holdings. Investors can consider exiting from the stock if the Target Price mentioned as per the Valuation has been achieved and subject to the factors discussed above.
Disclaimer
The advice given by Kalkine Canada Advisory Services Inc. and provided on this website is general information only and it does not take into account your investment objectives, financial situation and the particular needs of any particular person. You should therefore consider whether the advice is appropriate to your investment objectives, financial situation and needs before acting upon it. You should seek advice from a financial adviser, stockbroker or other professional (including taxation and legal advice) as necessary before acting on any advice. Not all investments are appropriate for all people. The website www.kalkine.ca is published by Kalkine Canada Advisory Services Inc. The link to our Terms & Conditions has been provided please go through them. On the date of publishing this report (mentioned on the website), employees and/or associates of Kalkine do not hold positions in any of the stocks covered on the website. These stocks can change any time and readers of the reports should not consider these stocks as advice or recommendations later.

 Please wait processing your request...