Sunrun Inc.
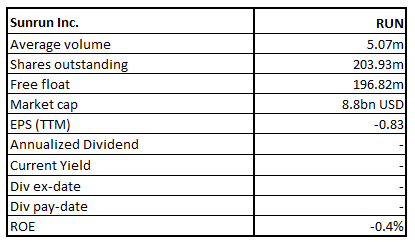
RUN Details
Sunrun Inc. (NASDAQ: RUN) is the top solar company player in the U.S with an entire focus on residential solar systems. It provides home solar, battery storage, and energy services to its customers present across 175 cities in 22 states and Puerto Rico.
FY20 Results Performance (For the Year Ended 31 December 2020)
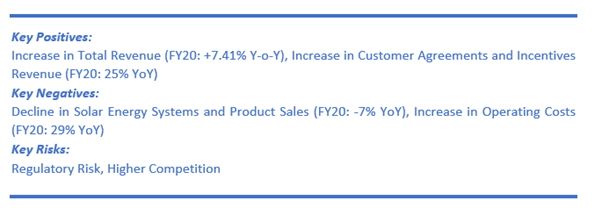
Total revenue during the period increased by 7.41% YoY to $922.19 million mainly led by a 25% YoY increase in revenue from customer agreements and incentive revenue to $484.2 million. However, the year witnessed a 7% YoY decline in revenue from solar energy systems and product sales to $438 million. Total operating costs for the year increased 29% YoY to $1387.3 million. A sharper rise in operating costs drove the company to report a net loss for the year to $173.4 million against the profit of $26.3 million reported in the previous year.
Customer additions for the full year remained healthy at 84,559, which also includes subscriber additions of 70,774. As on 31 December 2020, the company had 550,078 customers including 478,910 subscribers. Solar energy capacity installed during the year stood at 603 Megawatts while that for subscribers was 511 megawatts.
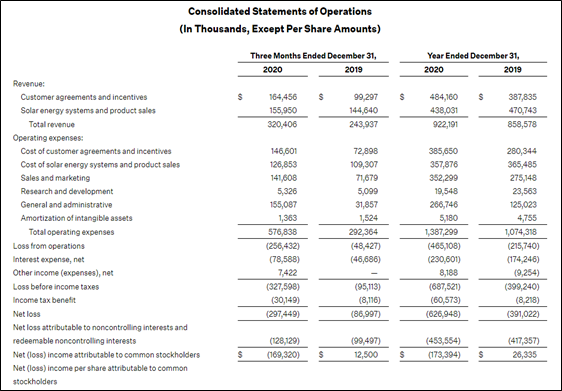
Consolidated Financial Snapshot (Source: Company Reports)
Q1FY21 Results Performance (For the Period Ended March 31, 2021)
RUN has logged a strong revenue growth of 59% YoY to $334.8 million. The period recorded a 76% increase in revenue from customer agreements and incentive revenue while an increase of 44% in revenue of solar energy systems and product sales on a QoQ basis. Total operating costs during the quarter increased by 44% to $160.2 million on a QoQ basis. Net loss for the quarter stood at $204.3 million against $109.5 million in the prior quarter. The customer additions remained healthy as it added 23,556 customers, including 20,087 subscriber additions that took its customer base to 573,634 as of March 31, 2021. The total value generated during the period was $164.7 million.
Recent Update
The company, on 19 May 2021, declared that it has formed a partnership with Ford Motor Company to assist in the installation of the 80-amp Ford Charge Station Pro and home integration system for the all-electric F-150 Lightning.
Outlook
Over the years, the company has been able to build a base of customers with recurring revenues. Q1FY21 witnessed revenue growth across segments which means revenue from solar energy systems and product sales also picking up rapidly which augurs well for the company.
The management has raised its growth guidance in solar energy capacity installed to 25% to 30% from its earlier prediction of 20%-25% growth for 2021. Additionally, it now expects to achieve a total value generated of over $750 million in 2021 as against its earlier guidance of $700 million. However, it reiterates garnering cost synergies of $120 million run-rate by the end of 2021.
Key Risks
The company’s operations are exposed to risks like the impact of COVID-19 on its business and operations as well as the effective integration of Vivint Solar, fluctuations in the electricity production retail prices, among others.
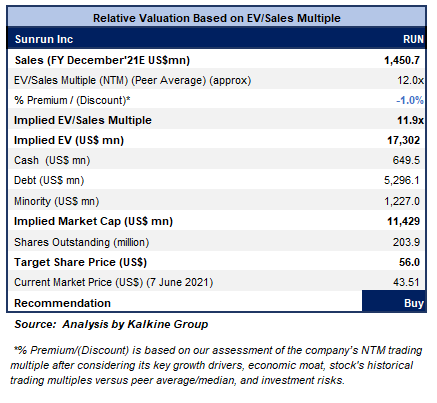
Valuation Methodology: EV/Sales Based Relative Valuation (Illustrative)
Technical Overview:
Weekly Chart –
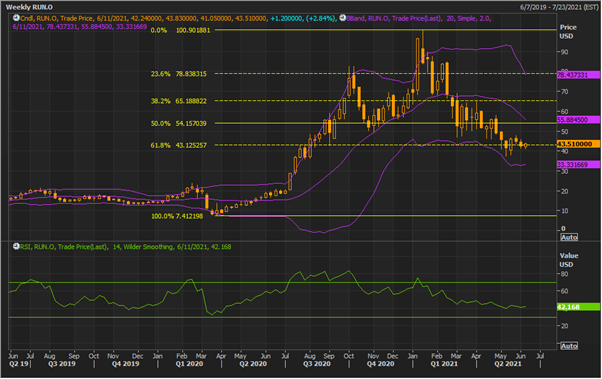
Source: REFINITIV
Note: Purple colour lines are Bollinger Bands® with the upper band suggesting overbought status while the lower band oversold status, and yellow lines are Fibonacci retracement lines which measure price rebound and backtrack. https://www.bollingerbands.com/
While trading broadly in a downtrend, the stock has given a stronger close at $43.51 with a 2.84% gain over the previous week’s close. The technical indicator RSI with a reading around 42 suggests neutral momentum for the stock.
Going forward, the stock may have resistance around the 50% retracement level of $54.15 whereas support could be around the lower Bollinger band of $33.33.
Stock Recommendation
The stock rose by ~132.7% in 1 year. It has made a 52-week low and high of $16.5 and $100.93, respectively. We have valued the stock using an EV/Sales multiple-based illustrative relative valuation and have arrived at a target price that reflects a rise of low double-digit (in % terms). We have applied a slight discount to EV/Sales Multiple (NTM) (Peer Average) considering its higher operating costs, negative earnings in Q1FY21 as well as higher debt levels. For the purposes of relative valuation, we have taken peers like Vicor Corp (VICR.OQ), Beam Global (BEEM.OQ), among others.
Considering its upgrade in guidance along with expanding market reach, healthy liquidity position, and decent growth outlook, we give a “Buy” recommendation on the stock at the current market price of US$43.51 per share, up by 2.84% on 7th June 2021.
Note 1: The reference data in this report has been partly sourced from REFINITIV.
Note 2: Investment decisions should be made depending on the investors’ appetite on upside potential, risks, holding duration, and any previous holdings. Investors can consider exiting from the stock if the Target Price mentioned as per the analysis has been achieved and subject to the factors discussed above alongside support levels provided.
Technical Indicators Defined:-
Support: A level where-in the stock prices tend to find support if they are falling, and downtrend may take a pause backed by demand or buying interest.
Resistance: A level where-in the stock prices tend to find resistance when they are rising, and uptrend may take a pause due to profit booking or selling interest.
Disclaimer
The advice given by Kalkine Canada Advisory Services Inc. and provided on this website is general information only and it does not take into account your investment objectives, financial situation and the particular needs of any particular person. You should therefore consider whether the advice is appropriate to your investment objectives, financial situation and needs before acting upon it. You should seek advice from a financial adviser, stockbroker or other professional (including taxation and legal advice) as necessary before acting on any advice. Not all investments are appropriate for all people. The website www.kalkine.ca is published by Kalkine Canada Advisory Services Inc. The link to our Terms & Conditions has been provided please go through them. On the date of publishing this report (mentioned on the website), employees and/or associates of Kalkine do not hold positions in any of the stocks covered on the website. These stocks can change any time and readers of the reports should not consider these stocks as advice or recommendations later.

 Please wait processing your request...