This report is an updated version of the report published on 04 September 2025 at 12:03 PM AEST.
Dicker Data Limited (ASX: DDR)
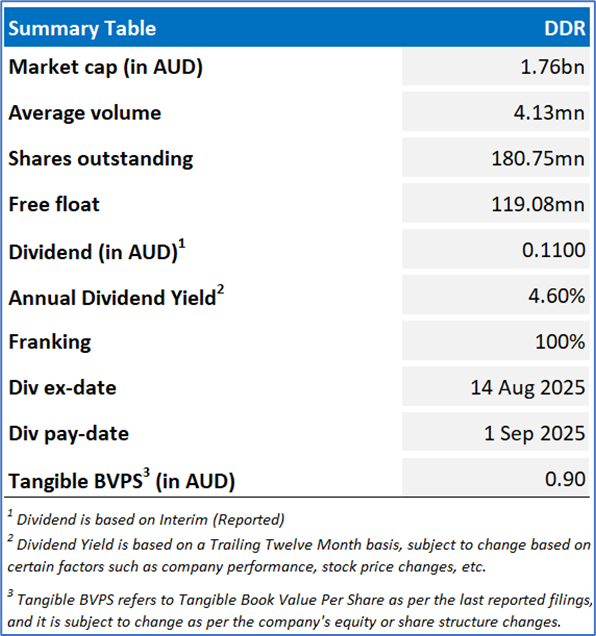
Dicker Data Limited (ASX: DDR) is an Australian-owned and operated, ASX-listed technology hardware, software, and cloud distributor in business since 1978. The Company distributes a wide portfolio of products from the world’s leading technology vendors, including Cisco, Citrix, Dell Technologies, Hewlett Packard Enterprise, HP, Lenovo, among others.
Recommendation Rationale – SELL at AUD 9.860
- Technical Standpoint: DDR’s share price has surpassed its R2 level, recommended on 17 June 2025. Also, the momentum oscillatory (14-day RSI is around 75.2 level), indicating an overbought zone. This shows increasing the likelihood of near-term consolidation or technical pullback.
- Overvalued Multiples: On a forward 12-month basis - key valuation multiples (EV/EBITDA, Price/Book, and Price/Cash Flow) are higher than median of the Technology Sector.
- Rising Expenses: In 1HFY25, total expenses rose 2.8% YoY, with operating expenses (excluding depreciation, amortisation, and finance costs) up AUD 4.2m, or 4.6%. The main driver was higher employee costs. These rising expenses are expected to place ongoing pressure on profit margins.
- Emerging Risks: DDR's global supply chain depends on accessing and transporting products, creating risks from supplier dependencies, geopolitical uncertainty, extreme weather, or pandemic slowdowns. Additionally, cyber security threats like ransomware, malware, and denial-of-service attacks pose significant risks, potentially disrupting operations and affecting system recovery and data protection.
DDR Daily Chart
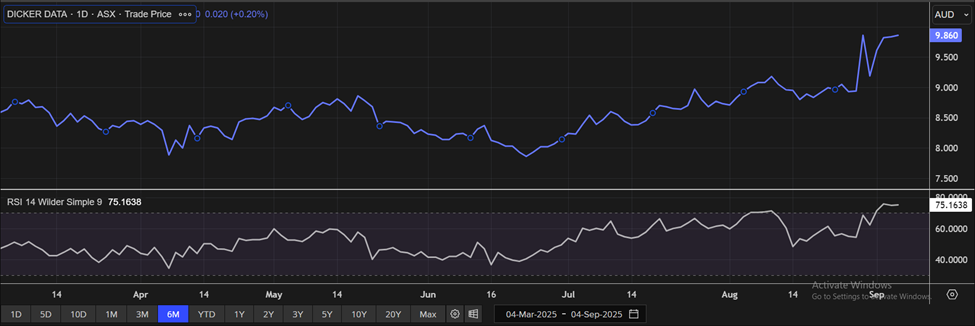
DDR Daily Technical Chart, Data Source: REFINITIV
Valuation Methodology: P/E Relative Valuation Approach (FY Dec'25E) (Illustrative)
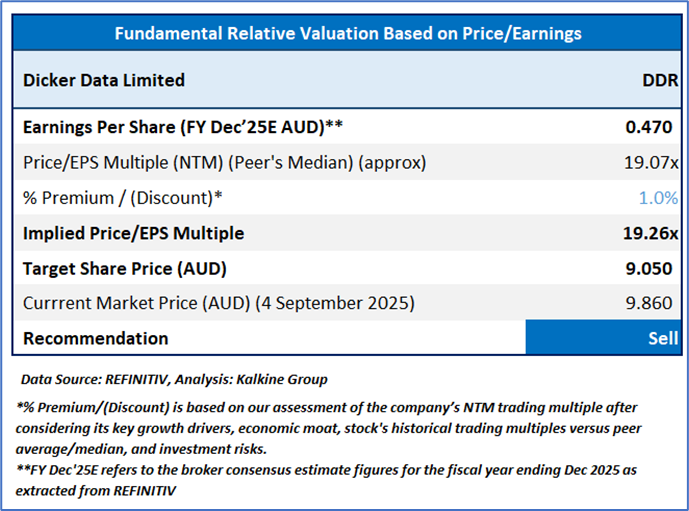
Considering the YoY increase in gross revenue in 1HFY25, accelerated PC refresh, AI driven deals, shift towards higher value, lower margin enterprise opportunities, etc., the stock might trade at a slight premium to its peers. For valuation, a few peers like Iress Ltd (ASX: IRE), Bravura Solutions Ltd (ASX: BVS), and Readytech Holdings Ltd (ASX: RDY) have been considered.
Considering that the stock has surpassed it R2 level, macroeconomic uncertainty, share price movement, current trading level, and risks associated, the share price can face consolidation at the current levels. Hence, a ‘Sell’ recommendation is given on the stock at the current market price of AUD 9.86, at 10:42 AM AEST, as of 4 September 2025.
Markets are trading in a highly volatile zone currently due to certain macro-economic issues and geopolitical issues prevailing geopolitical tensions. Therefore, it is prudent to follow a cautious approach while investing.
Note 1: Past performance is neither an indicator nor a guarantee of future performance.
Note 2: The reference date for all price data, currency, technical indicators, support, and resistance levels is 4 September 2025. The reference data in this report has been partly sourced from REFINITIV.
Note 3: Investment decisions should be made depending on an individual's appetite for upside potential, risks, holding duration, and any previous holdings. An 'Exit' from the stock can be considered if the Target Price mentioned as per the Valuation and or the technical levels provided has been achieved and is subject to the factors discussed above.
Note 4: Kalkine reports are prepared based on the stock prices captured either from REFINITIV or Trading View. Typically, REFINITIV or Trading View may reflect stock prices with a delay which could be a lag of 25-30 minutes. There can be no assurance that future results or events will be consistent with the information provided in the report. The information is subject to change without any prior notice.
Note 4: Dividend Yield may vary as per the stock price movement.
Technical Indicators Defined: -
Support: A level at which the stock prices tend to find support if they are falling, and downtrend may take a pause backed by demand or buying interest.
Resistance: A level at which the stock prices tend to find resistance when they are rising, and uptrend may take a pause due to profit booking or selling interest.
Stop-loss: In general, it is a level to protect further losses in case of any unfavourable movement in the stock prices.

 Please wait processing your request...