Alibaba Group Holding Ltd (NYSE: BABA)
It is an investment holding company mainly engaged in the provision of technology infrastructure and marketing platforms.
Recommendation Rationale – Sell at USD 147.10
- Financial Highlights: BABA’s sales and marketing expenses increased by 62.6% YoY to RMB 53,178mn in the quarter ended June 30, 2025 vs RMB 32,696 Mn in the same quarter of 202. This was primarily driven by significant investments in “Taobao Instant Commerce” and user acquisition initiatives. Adjusted EBITA declined by 14% YoY to RMB 38,844mn in the quarter ended June 30, 2025 vs RMB 45,035mn in the same quarter of 2024, primarily impacted by investment in “Taobao Instant Commerce”, user experiences, user acquisition and technology.
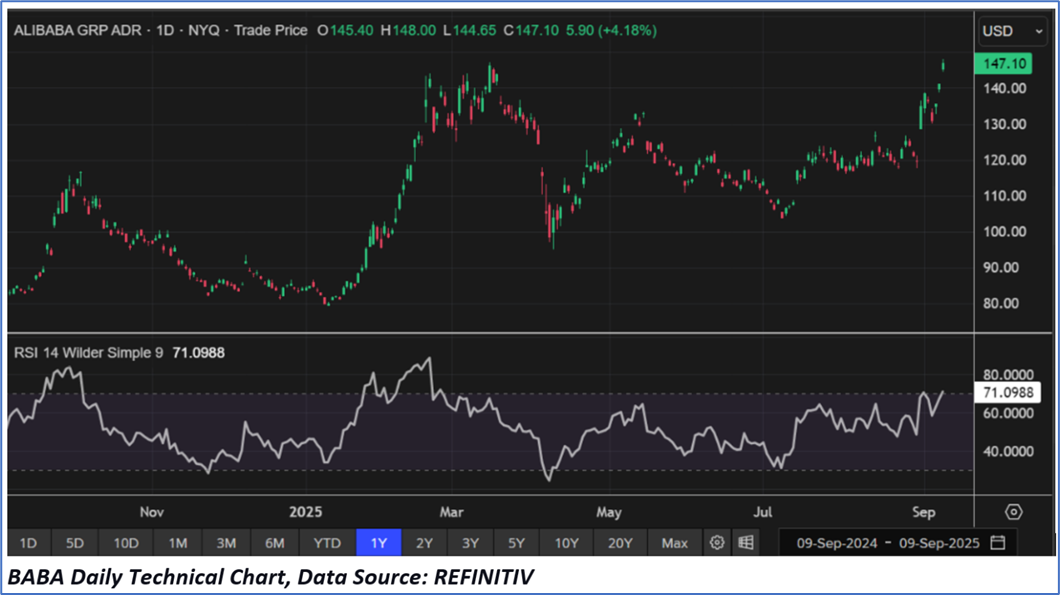
- Trading Near the Resistance: BABA stock has surpassed its R2 level recommended on 16 July 2025. Therefore, share price can face resistance at the current levels.
- Market Risk: Operating in the e-commerce and cloud computing sector, BABA faces risks from regulatory tightening in China, geopolitical tensions, supply chain disruptions, and currency fluctuations, while increasing competition, changing consumer behavior, etc. could constrain growth.
BABA’s Daily Price Chart
Valuation Methodology: P/E Multiple Approach (FY June'26E) (Illustrative)
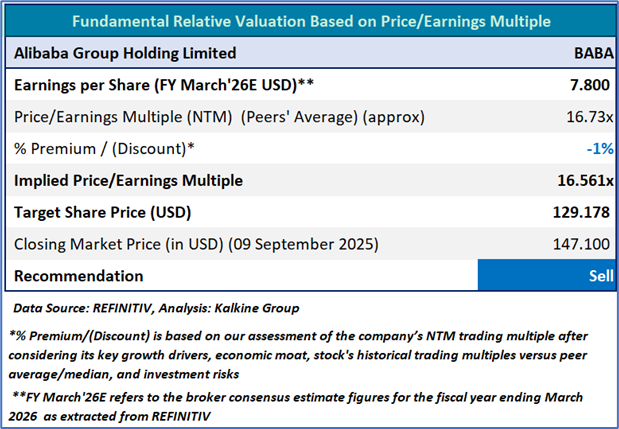
Considering the increasing volatility over global equity market, inflationary pressures, geopolitical tensions, etc. the company’s stock might trade at slight discount. For conducting the valuation, the following peers included: Electronic Arts Inc (NASDAQ: EA), NetEase Inc (NASDAQ: NTES), and eBay Inc (NASDAQ: EBAY) have been considered.
Hence, a ‘Sell’ rating has been provided on the stock at the closing price of USD 147.10 per share, up by 4.18% as on 9 September 2025.
Alibaba Group Holding Ltd (NYSE: BABA) is part of Kalkine’s Global Big Money Portfolio.
Markets are trading in a highly volatile zone currently due to certain macro-economic issues and geopolitical issues prevailing geopolitical tensions. Therefore, it is prudent to follow a cautious approach while investing.
Note 1: Past performance is neither an indicator nor a guarantee of future performance.
Note 2: The reference date for all price data, currency, technical indicators, support, and resistance levels is 09 September 2025. The reference data in this report has been partly sourced from REFINITIV.
Note 3: Investment decisions should be made depending on an individual's appetite for upside potential, risks, holding duration, and any previous holdings. An 'Exit' from the stock can be considered if the Target Price mentioned as per the Valuation and or the technical levels provided has been achieved and is subject to the factors discussed above.
Note 4: Kalkine reports are prepared based on the stock prices captured either from REFINITIV or Trading View. Typically, REFINITIV or Trading View may reflect stock prices with a delay which could be a lag of 25-30 minutes. There can be no assurance that future results or events will be consistent with the information provided in the report. The information is subject to change without any prior notice.
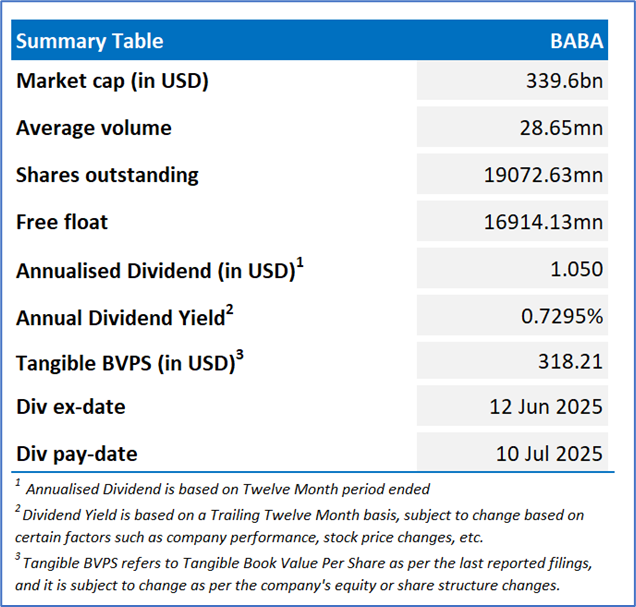
Note 5: Dividend Yield may vary as per the stock price movement.
Technical Indicators Defined: -
Support: A level at which the stock prices tend to find support if they are falling, and downtrend may take a pause backed by demand or buying interest.
Resistance: A level at which the stock prices tend to find resistance when they are rising, and uptrend may take a pause due to profit booking or selling interest.
Stop-loss: In general, it is a level to protect further losses in case of any unfavourable movement in the stock prices.

 Please wait processing your request...