Section1: Company Overview

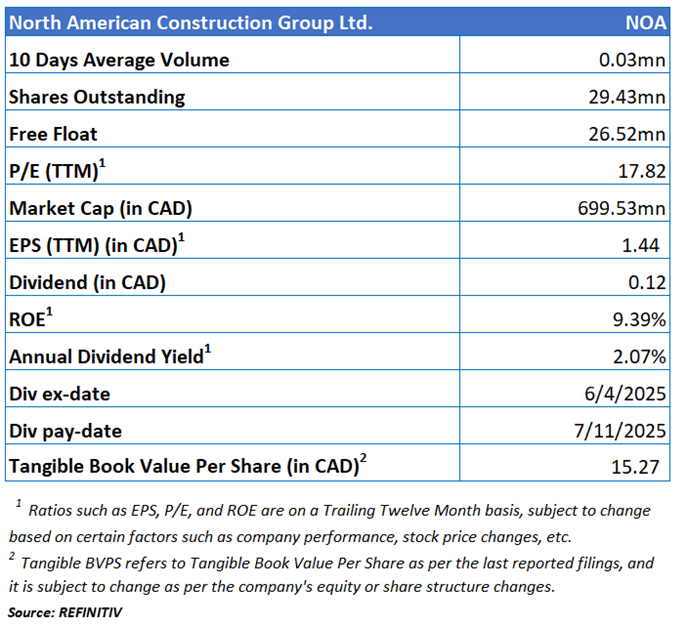
North American Construction Group Ltd. (TSX: NOA) is Canada's provider of heavy civil construction and mining contractors. The company has provided services to the oil, natural gas and resource companies.
This Report covers the Investment Highlights, Key Financial Metrics, Risks, Technical Analysis along with the Valuation, Target Price, and Recommendation on the stock.

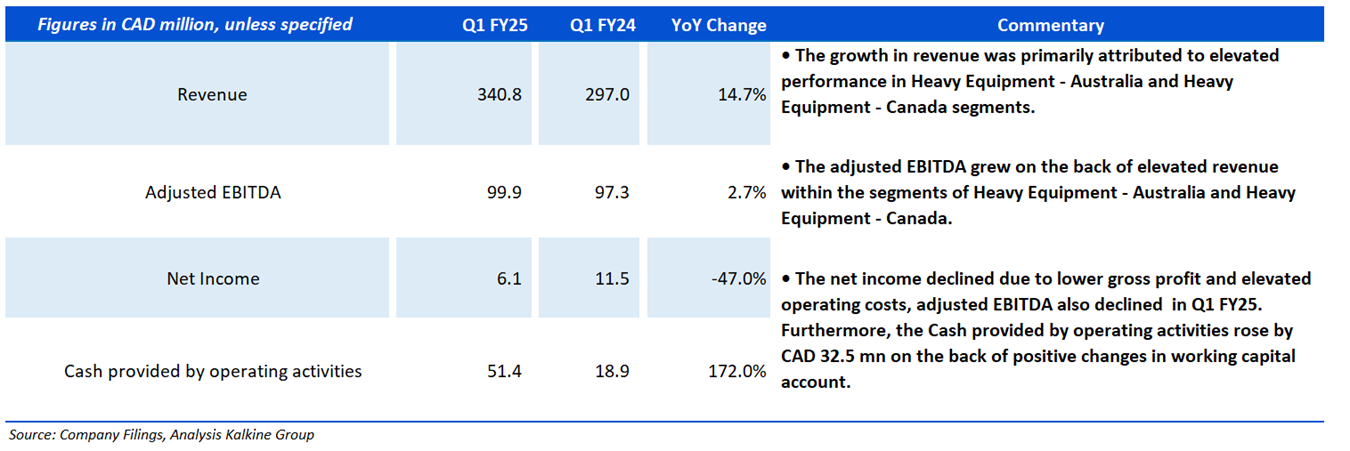
Section2: Financial Highlights – Q1 FY25

Section 3: Stock Recommendation Summary

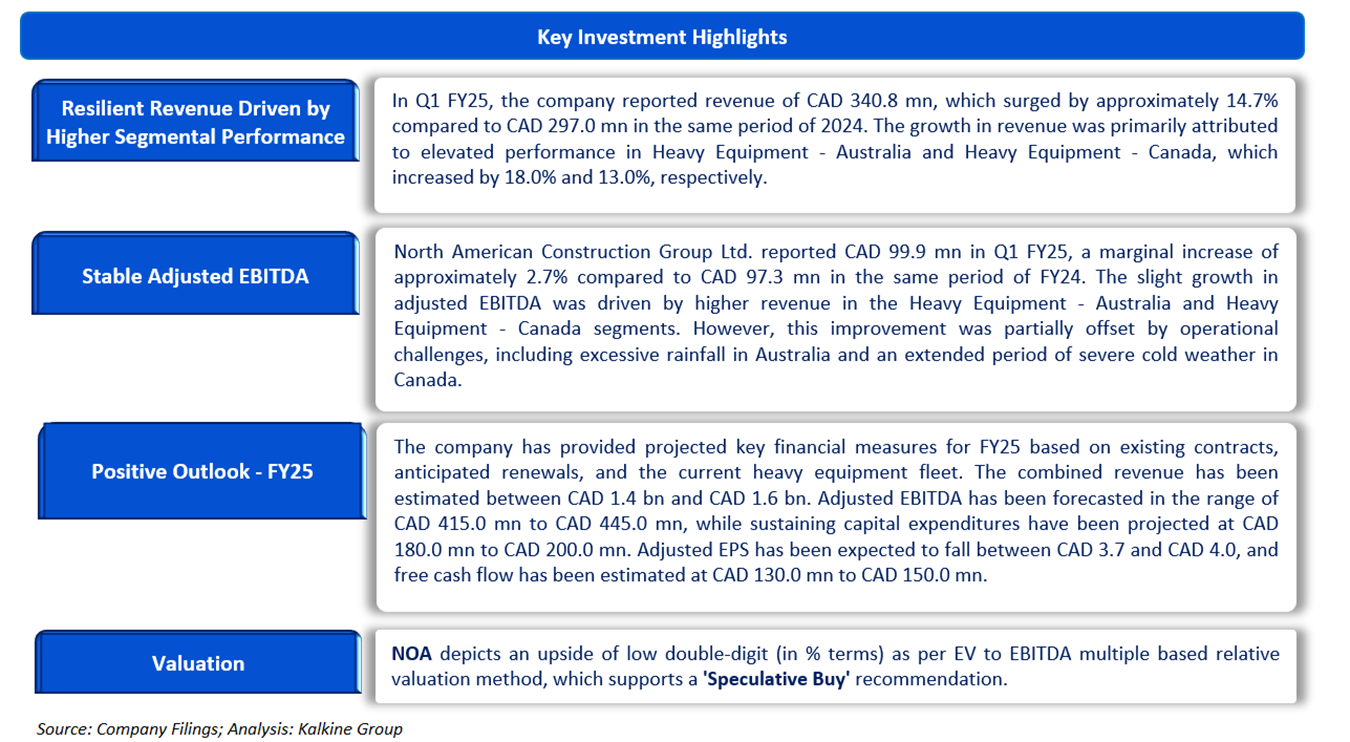
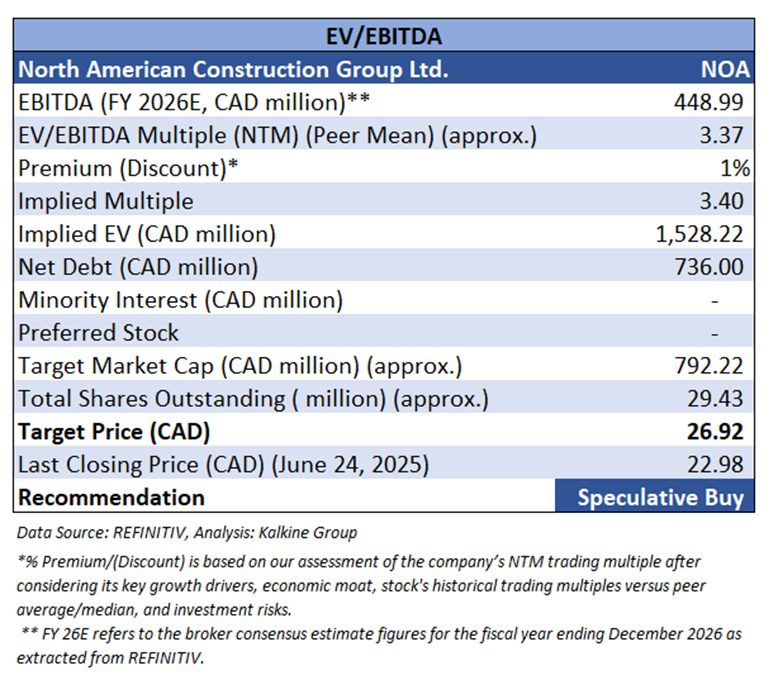
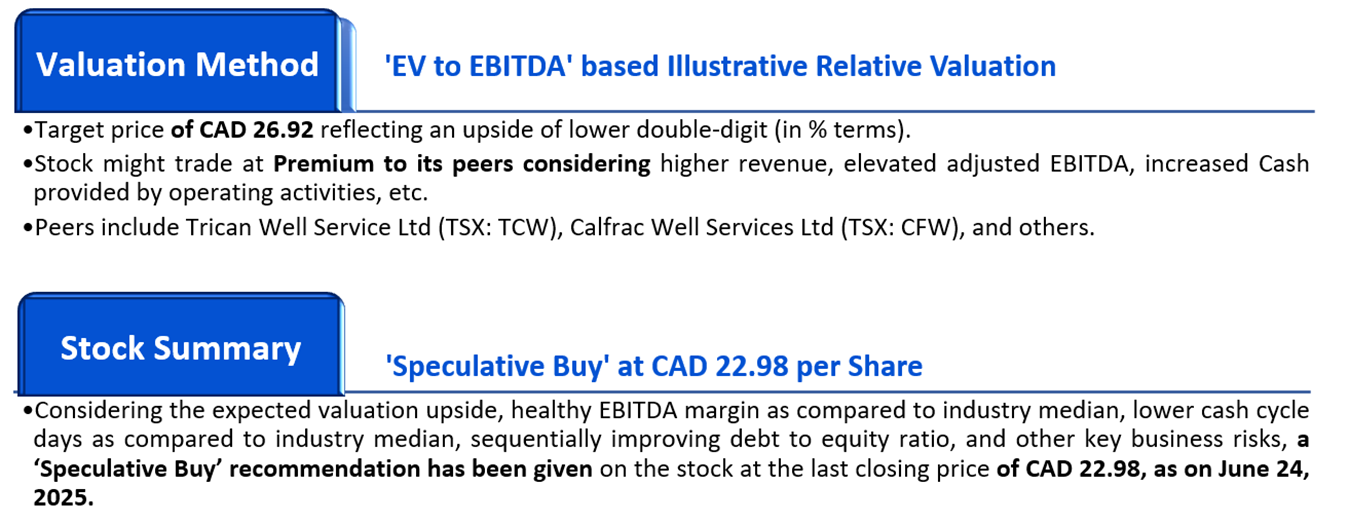
Valuation Methodology: EV/EBITDA Multiple Based Relative Valuation (Illustrative):


The stock has witnessed a downside of ~6.31% and of ~1.54% over the 1 week and 3 months respectively. It is trading below the average of 52-week high price of CAD 31.66 and 52-week low price of CAD 18.83, providing an opportunity to accumulate the stock.

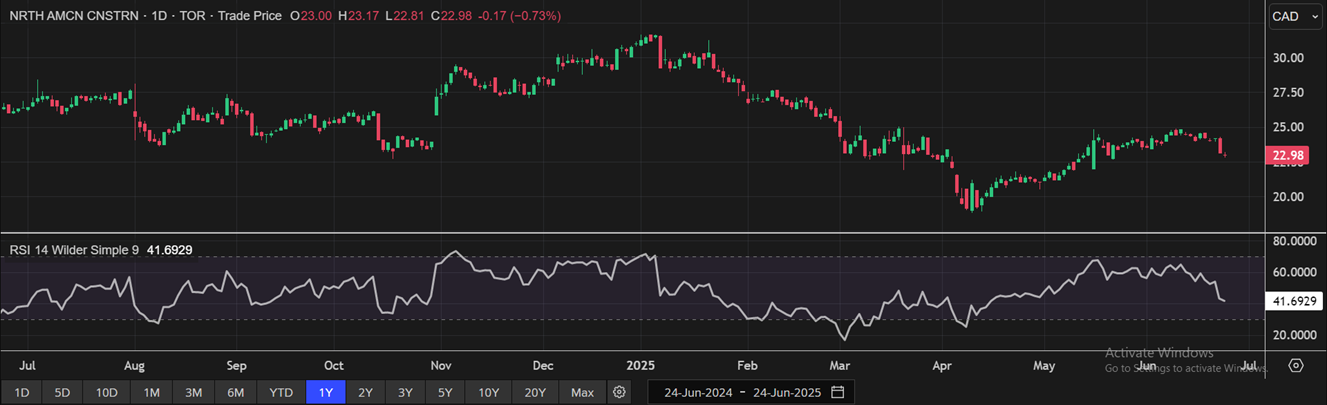
One-Year Technical Price Chart (as of June 24, 2025). Source: REFINITIV, Analysis: Kalkine Group

Note 1: Past performance is not a reliable indicator of future performance.
Note 2: The reference date for all price data, currency, technical indicators, support, and resistance levels as on June 24, 2025. The reference data in this report has been partly sourced from REFINITIV.
Note 3: Investment decisions should be made depending on an individual's appetite for upside potential, risks, holding duration, and any previous holdings. An 'Exit' from the stock can be considered if the Target Price mentioned as per the Valuation and or the technical levels provided has been achieved and is subject to the factors discussed above.
Note 4: Dividend Yield may vary as per the stock price movement.
Note 5: Kalkine reports are prepared based on the stock prices captured either from REFINITIV or Trading View. Typically, REFINITIV or Trading View may reflect stock prices with a delay which could be a lag of 25-30 minutes. There can be no assurance that future results or events will be consistent with the information provided in the report. The information is subject to change without any prior notice.
Technical Indicators Defined: -
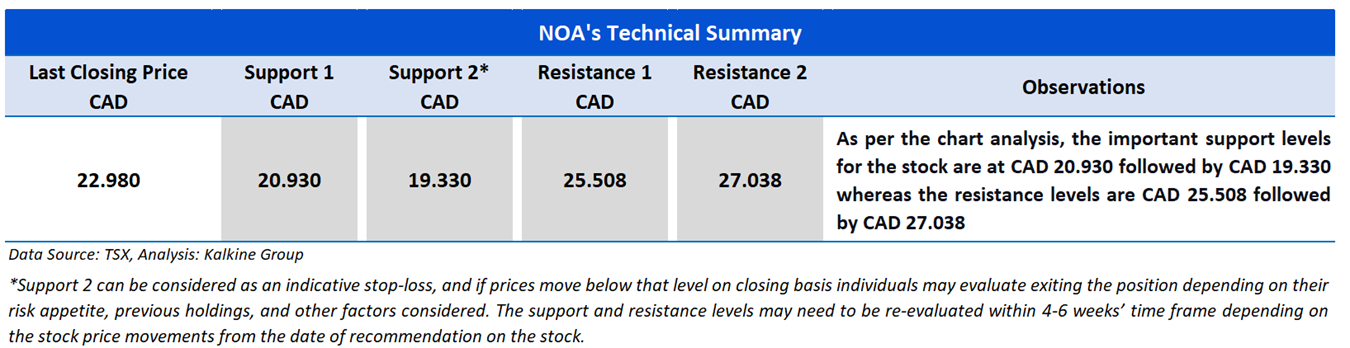
Support: A level at which the stock prices tend to find support if they are falling, and a downtrend may take a pause backed by demand or buying interest.
Resistance: A level at which the stock prices tend to find resistance when they are rising, and the uptrend may take a pause due to profit booking or selling interest.
Stop-loss: In general, it is a level to protect further losses in case of any unfavourable movement in the stock prices.

 Please wait processing your request...