
Section1: Company Overview
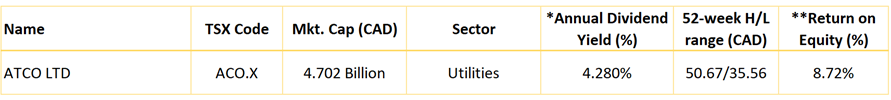
Atco Ltd (TSX: ACO.X) is a Canadian holding company that offers gas, electric, and infrastructure solutions. The largest subsidiary of the company is Canadian utilities, which operates natural gas, electricity, and logistical services. Atco's primary segments include Structures and Logistics; Utilities; Energy Infrastructure; Neltume Ports and Corporate and Other. It generates maximum revenue from the Utilities segment. Geographically, it derives most of its revenue from Canada.
This Report covers the Investment Highlights, Key Financial Metrics, Risks, Technical Analysis along with the Valuation, Target Price, and Recommendation on the stock.
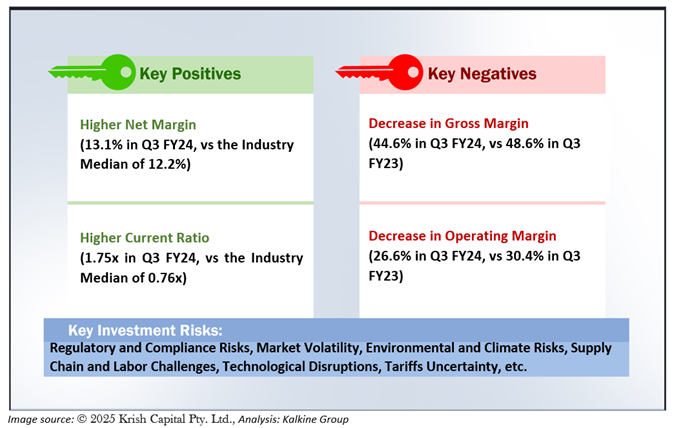
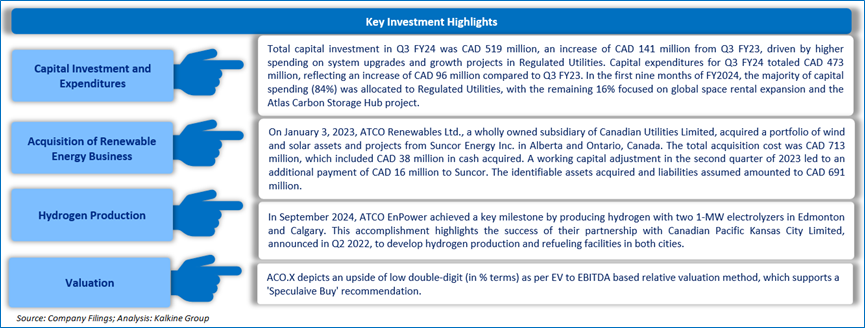
1.1 The Key Positives, Negatives, Investment Highlights, and Risks
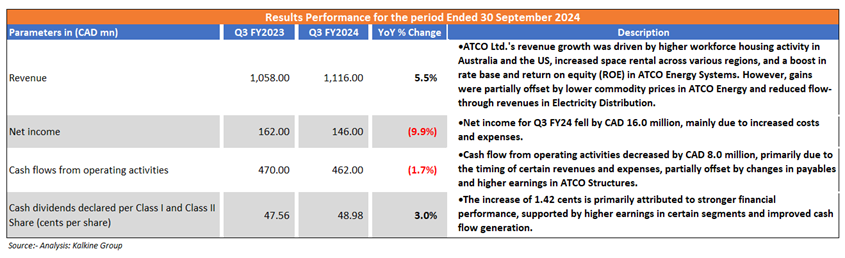
Section2: Financial Highlights
2.1 Key Financial Highlights
Section 3: Stock Recommendation Summary
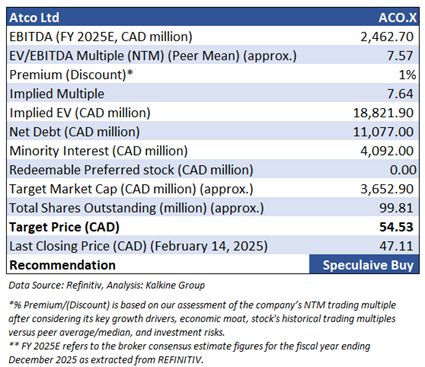
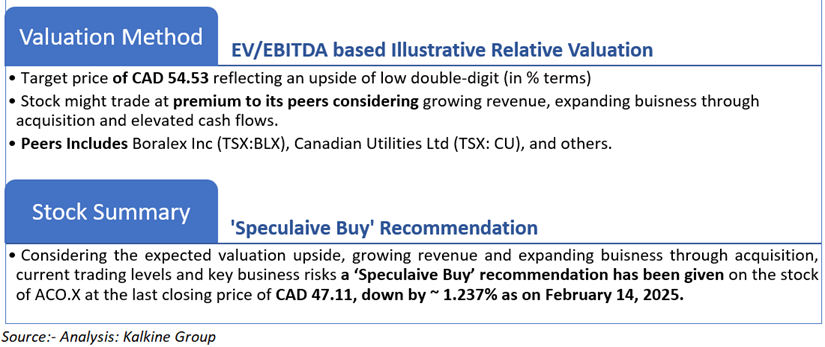
3.1 Valuation Methodology
Valuation Methodology (Illustrative): EV to EBITDA based
3.2 Price Performance and Stock Recommendation

The stock has witnessed an upward of ~2.48% and downward of ~2.97% over the last 1 month and 3 months respectively. Moreover, the stock is trading above the average of 52-week high price of CAD 50.67 and 52-week low price of CAD 35.56, providing an opportunity to ride the trend.
3.3 One-Year Technical Price Chart
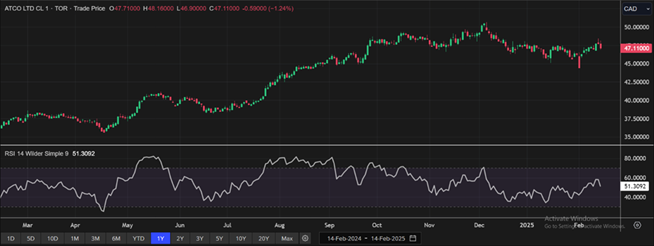
One-Year Technical Price Chart (as of February 14, 2025). Source: REFINITIV, Analysis: Kalkine Group
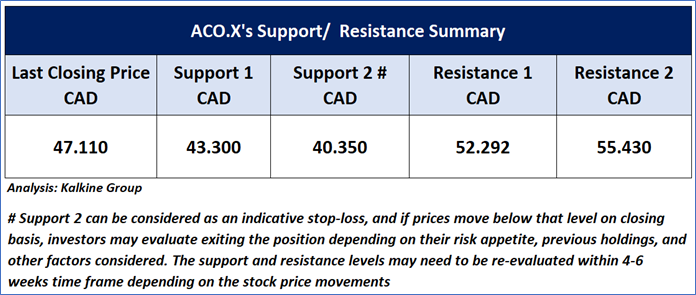
3.4 Technical Summary
Note 1: Past performance is not a reliable indicator of future performance.
Note 2: The reference date for all price data, currency, technical indicators, support, and resistance levels as on February 14, 2025. The reference data in this report has been partly sourced from REFINITIV.
Note 3: Investment decisions should be made depending on an individual's appetite for upside potential, risks, holding duration, and any previous holdings. An 'Exit' from the stock can be considered if the Target Price mentioned as per the Valuation and or the technical levels provided has been achieved and is subject to the factors discussed above.
Note 4: Dividend Yield may vary as per the stock price movement.
Note 5: Kalkine reports are prepared based on the stock prices captured either from REFINITIV or Trading View. Typically, REFINITIV or Trading View may reflect stock prices with a delay which could be a lag of 25-30 minutes. There can be no assurance that future results or events will be consistent with the information provided in the report. The information is subject to change without any prior notice.’
Technical Indicators Defined: -
Support: A level at which the stock prices tend to find support if they are falling, and a downtrend may take a pause backed by demand or buying interest.
Resistance: A level at which the stock prices tend to find resistance when they are rising, and the uptrend may take a pause due to profit booking or selling interest.
Stop-loss: In general, it is a level to protect further losses in case of any unfavourable movement in the stock prices.

 Please wait processing your request...