Shoals Technologies Group, Inc.

SHLS Details
Shoals Technologies Group, Inc. (NASDAQ: SHLS) provides an electrical balance of system solutions for solar energy projects in the US. Primarily, it sells its products to engineering, procurement, and construction firms that build solar energy projects.
Result Performance – For the First Quarter Ended 31 March 2021 – (Q1FY21)
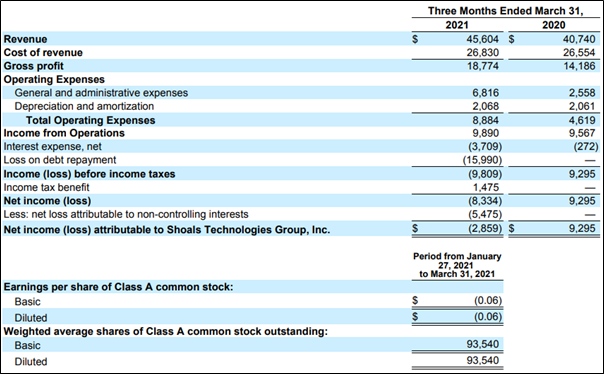
- Uptick in Revenues: For the first quarter ended 31 March 2021, the revenues of the company reported at $45.6 million, an increase of 12% YoY, led by a 46% YoY rise in system solutions revenues which were partly nullified by a fall in components revenues. The rise in system solutions revenues reflects significant demand for the company’s combine-as-you-go system. In addition, the sale of system solutions represented 73% of revenues over 56% in pcp.
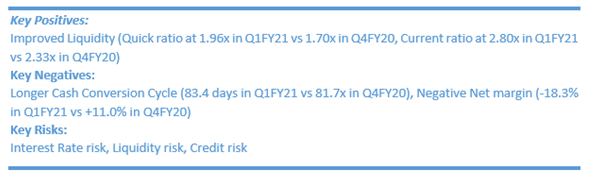
- Profitability Growth: The gross profit grew 32% YoY to $18.8 million and the gross margin increased by 635 bps to 41.2% from 34.8% in pcp. Adjusted EBITDA grew 17% YoY to $14.1 million. Further, income from operations was $9.9 million over $9.6 million, up 3% YoY.
- Impact on Net Income: Meanwhile, net loss was $8.3 million, over net income of $9.3 million in pcp. The decrease in net income was due to a $16.0 million charge reported in the first quarter in relation with an early repayment of a portion of its term loan facility.
Key Data (Source: Company Reports)
Risks:
The financial performance of the company depends on the demand for solar energy projects. Further, the company is exposed to industry policies and regulations, and any subsequent changes, that may present technical, regulatory, and economic barriers to the purchase and use of solar energy systems. Also, the viability and demand for solar energy and the demand for the products are impacted by many factors outside of control, which makes it difficult to predict future prospects.
Outlook:
Amid current business conditions, business trends, and other factors, the company expects revenues to be in the ambit of $230- $240 million, up 31.0% to 36.7% YoY, adjusted EBITDA to be in the ambit of $75-$80 million, and adjusted net income between $47-$51 million. Also, the company forecasts ~45% of its revenues to be recorded in the H1FY21, using the midpoint of guidance.
Valuation Methodology: EV/Sales Multiple Based Relative Valuation (Illustrative)
Stock Recommendation:
Over the last one month, the stock was up by ~+23.23% while, over the last three months, and the stock was up by ~+1.704%. The stock is trading above the average price of the 52-week low-high range of $20.94-$44.04, respectively.
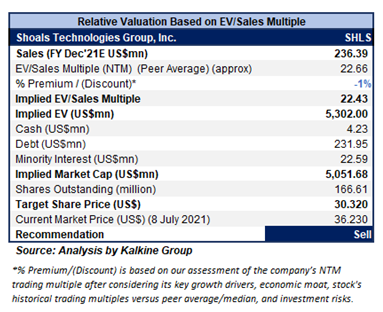
We have applied an EV/Sales based relative valuation (on an illustrative basis) and there are expectations that the stock price might witness a fall of low double-digit (in % terms). We have applied a slight discount to EV/Sales Multiple (NTM) (Peer Average) considering negative ROIC in Q1FY21 from positive ROIC in Q4FY20.
Considering aforesaid facts, current trading levels, associated risks, we suggest Investors to Book Profit and hence we give a ‘Sell’ recommendation on the stock at the current market price of $36.23 per share as on 10:45 PM (GMT+08:00 Australia Western Time) as on 8th July 2021.
Daily Technical Analysis Chart
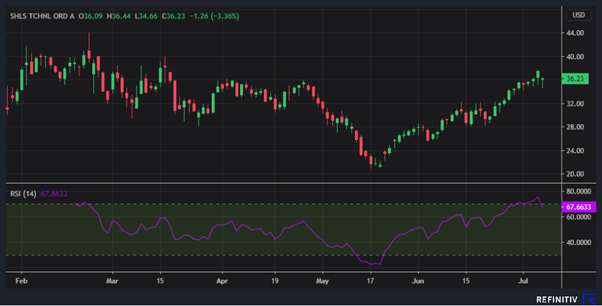
Source: REFINITIV
Note 1: The reference data in this report has been partly sourced from REFINITIV.
Note 2: Investment decisions should be made depending on the investors’ appetite on upside potential, risks, holding duration, and any previous holdings. Investors can consider exiting from the stock if the Target Price mentioned as per the analysis has been achieved and subject to the factors discussed above alongside support levels provided.
Technical Indicators Defined:-
Support: A level where-in the stock prices tend to find support if they are falling, and downtrend may take a pause backed by demand or buying interest.
Resistance: A level where-in the stock prices tend to find resistance when they are rising, and uptrend may take a pause due to profit booking or selling interest.
Disclaimer
The advice given by Kalkine Canada Advisory Services Inc. and provided on this website is general information only and it does not take into account your investment objectives, financial situation and the particular needs of any particular person. You should therefore consider whether the advice is appropriate to your investment objectives, financial situation and needs before acting upon it. You should seek advice from a financial adviser, stockbroker or other professional (including taxation and legal advice) as necessary before acting on any advice. Not all investments are appropriate for all people. The website www.kalkine.ca is published by Kalkine Canada Advisory Services Inc. The link to our Terms & Conditions has been provided please go through them. On the date of publishing this report (mentioned on the website), employees and/or associates of Kalkine do not hold positions in any of the stocks covered on the website. These stocks can change any time and readers of the reports should not consider these stocks as advice or recommendations later.

 Please wait processing your request...