Energizer Holdings, Inc
ENR Details
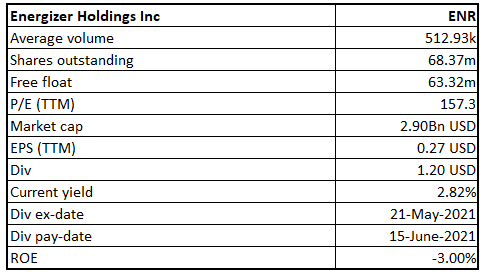
Energizer Holdings, Inc (NASDAQ: ENR) is one of the world’s leading manufacturers of primary batteries and portable lighting products. It has key global brands viz; Energizer®, EVEREADY®, Rayovac®, and VARTA®.
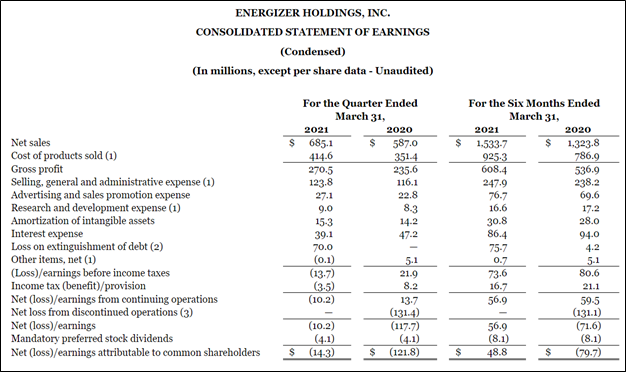
Q2FY21 Result Performance (For the Second Quarter Ended 31 March 2021)
The company has posted a strong net sales growth of 16.7% to $685.1 million driven by robust demand for batteries and auto across geographies. However, it witnessed a 110 basis points decline in adjusted gross margin from the prior year to 40.5% mainly weighed down by the channel, customer, and product mix along with the impact of increased operating costs. The benefits of synergies of around $14 million and favourable currency exchange rates have restricted the decline. Meanwhile, it has reported a diluted net loss from continuing operations per common share of $0.21 due to a loss related to debt refinancing of $0.78 per share.
Financial Snapshot (Source: Company Reports)
Outlook
The company witnessed organic net sales growth of 12.7%, or $74.7 million in Q2 FY 2021. The company believes that organic sales momentum will be continuing in the upcoming years amidst an uplift in business sentiment. ENR expects to achieve net sales growth in the range of 5% to 7% for FY21 owing to distribution gains, higher battery demand and favourable currency impacts. It also expects to attain adjusted earnings per share of between $3.30 to $3.50 on the back of strong demand for its brands and products along with improving cost control. Further, adjusted free cash flow is estimated to stay at the lower end of its earlier guided range of $325 to $350 million due to working capital requirements, with respect to inventory to cater to increased demand.
Key Risks
The company is exposed to the risk of currency fluctuations, which may adversely hurt its financial performance. Volatility in production costs primarily the raw material prices, could erode its profit margins. Further, the risk of changes in the retail environment and consumer preferences also remain a major concern. Moreover, it faces the risk of supply chain disruption and the risk of reliance on certain significant suppliers.
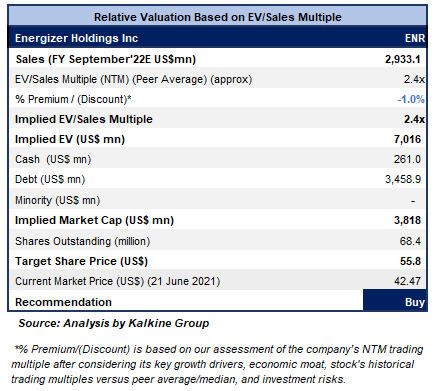
Valuation Methodology: EV/Sales Based Relative Valuation (Illustrative)
Technical Overview:
Weekly Chart –
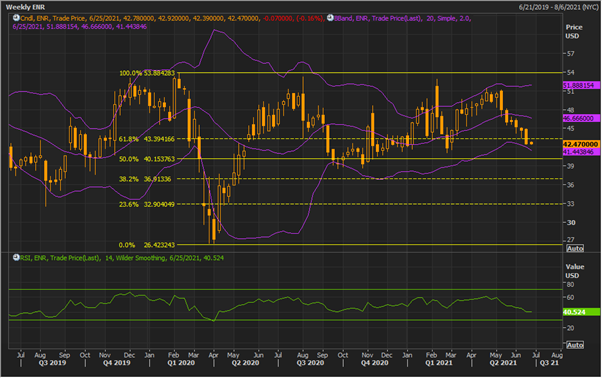
Source: REFINITIV
Note: Purple colour lines are Bollinger Bands® with the upper band suggesting overbought status while the lower band oversold status, and yellow lines are Fibonacci retracement lines which measure price rebound and backtrack. https://www.bollingerbands.com/
The stock made a ‘Double Bottom’ at $26.42 and rebounded close to its high of $53.88 but could not breach the same. In the process, it kept correcting and rebounding, and traded above the 61.8% retracement level of $43.39. For the ongoing week, it has given a softer close at $42.47. The technical indicator RSI with a reading around $41 suggests neutral momentum for the stock.
Going forward, the stock may have resistance around 20 periods SMA of $46.67 whereas support could be around the 50% retracement level of $40.15.
Stock Recommendation
The stock declined by ~9.71% in 3 months. It has made a 52-week low and high of $38.59 and $53.19, respectively.
We have valued the stock using an EV/Sales multiple-based illustrative relative valuation and have arrived at a target price that reflects a rise of low double-digit (in % terms). We have assigned a slight discount to EV/Sales Multiple (NTM) (Peer Average) considering cost side inflation and expectation of lower adjusted free cash flow generation due to higher capex. Meanwhile, recently, the company has announced its intention of the broad-based increase in prices across its global battery business to equipoise the impact of cost side pressure. These price increases will be phased throughout in fiscal 2022 and it aims to generate the entire benefit of these changes in the back half of fiscal 2022. For the purposes of relative valuation, we have taken peers like Reynolds Consumer Products Inc (REYN.OQ), Church & Dwight Co Inc (CHD.N), to name a few.
Considering the aforementioned factors, elevated battery demand, steady strong organic growth, and decent outlook, we give a “Buy” recommendation on the stock at the current market price of $42.47 per share, down by 0.16% on 21st June 2021.
Note 1: The reference data in this report has been partly sourced from REFINITIV.
Note 2: Investment decisions should be made depending on the investors’ appetite on upside potential, risks, holding duration, and any previous holdings. Investors can consider exiting from the stock if the Target Price mentioned as per the analysis has been achieved and subject to the factors discussed above alongside support levels provided.
Technical Indicators Defined: -
Support: A level where-in the stock prices tend to find support if they are falling, and downtrend may take a pause backed by demand or buying interest.
Resistance: A level where-in the stock prices tend to find resistance when they are rising, and uptrend may take a pause due to profit booking or selling interest.
Disclaimer
The advice given by Kalkine Canada Advisory Services Inc. and provided on this website is general information only and it does not take into account your investment objectives, financial situation and the particular needs of any particular person. You should therefore consider whether the advice is appropriate to your investment objectives, financial situation and needs before acting upon it. You should seek advice from a financial adviser, stockbroker or other professional (including taxation and legal advice) as necessary before acting on any advice. Not all investments are appropriate for all people. The website www.kalkine.ca is published by Kalkine Canada Advisory Services Inc. The link to our Terms & Conditions has been provided please go through them. On the date of publishing this report (mentioned on the website), employees and/or associates of Kalkine do not hold positions in any of the stocks covered on the website. These stocks can change any time and readers of the reports should not consider these stocks as advice or recommendations later.

 Please wait processing your request...