Celsius Holdings, Inc.
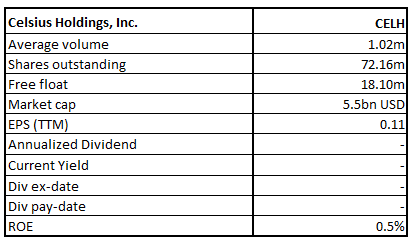
CELH Details
Celsius Holdings, Inc. (NASDAQ: CELH) is engaged in the development, marketing, sale, and distribution of functional calorie-burning beverages. The company currently offers five beverage lines including Celsius® Originals, CelsiusHEAT ™, Celsius ® BCAA + Energy, Celsius ® On-the-Go and Celsius ®Sweetened with Stevia. The company has a market capitalization of ~$5.5 billion as on 2nd June 2021.
Results Performance (Year Ended 31 December 2020)
Revenue of the company for the full-year period stood at around $130.7 million, an increase of 74.0% on the previous year. North America with 60% YoY increase in revenue to $95.5 million, contributed significantly to total revenue. The balance of the increase was largely attributable to a 35% growth in European revenues to $33.7 million in 2020 from $14.5 million in 2019. Net income of the company for the year stood at $8.5 million, as compared to net income of $10.0 million in 2019.

Key Data (Source: Company Reports)
Results Performance (Q1FY21 Ended 31 March 2021)
Revenue growth in the period stood at $50.0 million, an increase of 78% YoY. North America contributed to about 90% of revenue growth having experienced 101% growth in revenue to $19.4 million over the prior quarter. The balance of the increase came from 22% growth in European revenues over the prior quarter to $10.4 million. Asian revenues increased 100% to $536K over the prior quarter, while other international markets generated $128K revenue from $57K in the previous quarter.
Outlook:
The company intends to use Func Food (acquired in October 2019) as a platform to expand product distribution elsewhere in Europe. Func Food was CELH’s Nordic distribution partner which markets products under its own brands. Further, it is closely monitoring the COVID-19 pandemic and its potential impact on its supply chain, distribution and consolidated results of operations.
Key Risks:
The company’s business and results of operations may be adversely affected by changes in the global macro-economic environment which may also include the negative impacts from the pandemic.
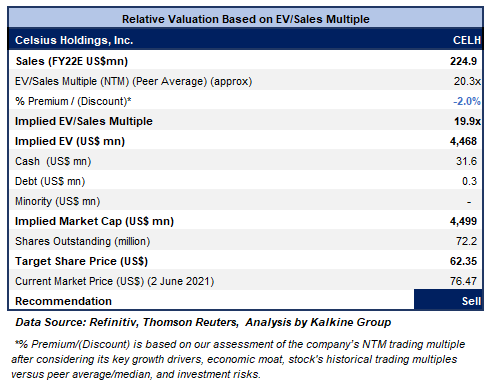
Valuation Methodology: EV/Sales Multiple Based Relative Valuation (Illustrative)
Technical Overview:
Weekly Chart –
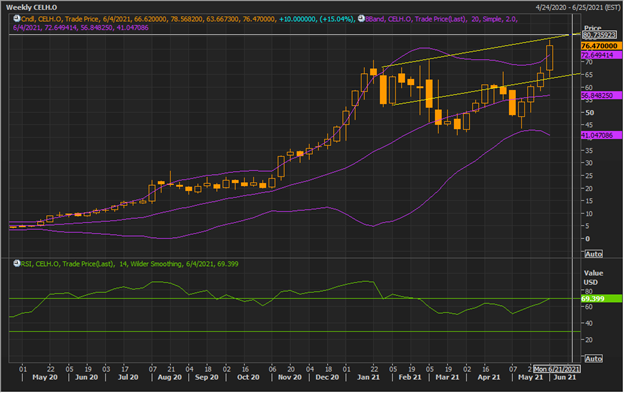
Source: Refinitiv (Thomson Reuters)
Note: Purple colour lines are Bollinger Bands® with the upper band suggesting overbought status while the lower band oversold status, and yellow lines are Fibonacci retracement lines which measure price rebound and backtrack. https://www.bollingerbands.com/
The stock having experienced a smooth ride, it has been experiencing uneven ride, lately. However, in the process, it has managed to make a new high. The technical indicator RSI with a reading around 69, suggests that the stock is near the overbought zone, thereby, limiting the potential for the upside.
Going forward, the stock may have resistance around $80.73 whereas support could be around $65.00.
Stock Recommendation:
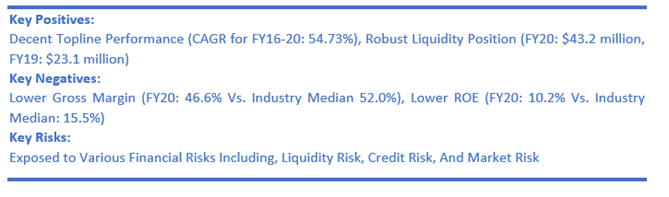
The company’s gross margin and EBITDA margin improved from 41.7% and -0.7% in FY19 to 46.6% and 6.8% in FY20, respectively. However, its net margin for FY20 stood at 6.5%, lower than the industry median of 10.1%. ROE for FY20 stood at 10.2%, lower than the industry median of 15.5%.
Considering the lower ROE that the company generated in FY20 and the lingering of the pandemic, it is advisable for investors to book profits at the current level.
We have applied EV/Sales multiple-based relative valuation (on an illustrative basis) and there are expectations that the stock price might witness a fall of low double-digit (in % terms). We have applied a slight discount to EV/Sales Multiple (NTM) (Peer Average) considering lower ROE and gross margin as well as the risks associated.
The stock rose by ~284.4% in 9 months. It has made a 52-week low and high of $8.51 and $70.66, respectively. Considering the movement in the stock price, it looks like most of the positive developments have been discounted in the current price.
Hence, we give a “Sell” recommendation on the stock at the current market price of $76.47 per share, up by 15.04% on 2nd June 2021.
Note 1: The reference data in this report has been partly sourced from REFINITIV.
Note 2: Investment decisions should be made depending on the investors’ appetite on upside potential, risks, holding duration, and any previous holdings. Investors can consider exiting from the stock if the Target Price mentioned as per the analysis has been achieved and subject to the factors discussed above alongside support levels provided.
Technical Indicators Defined:-
Support: A level where-in the stock prices tend to find support if they are falling, and downtrend may take a pause backed by demand or buying interest.
Resistance: A level where-in the stock prices tend to find resistance when they are rising, and uptrend may take a pause due to profit booking or selling interest.
Disclaimer
The advice given by Kalkine Canada Advisory Services Inc. and provided on this website is general information only and it does not take into account your investment objectives, financial situation and the particular needs of any particular person. You should therefore consider whether the advice is appropriate to your investment objectives, financial situation and needs before acting upon it. You should seek advice from a financial adviser, stockbroker or other professional (including taxation and legal advice) as necessary before acting on any advice. Not all investments are appropriate for all people. The website www.kalkine.ca is published by Kalkine Canada Advisory Services Inc. The link to our Terms & Conditions has been provided please go through them. On the date of publishing this report (mentioned on the website), employees and/or associates of Kalkine do not hold positions in any of the stocks covered on the website. These stocks can change any time and readers of the reports should not consider these stocks as advice or recommendations later.

 Please wait processing your request...