
Skeena Resources Limited (TSX: SKE) is a leading precious metals development company focused on advancing the Eskay Creek Gold-Silver Project in British Columbia,s Golden Triangle. With the Project fully permitted and under construction, the Company is progressing Eskay Creek towards initial production and cash flow in the second quarter of 2027. Once in operation, Eskay Creek is expected to be one of the world,s highest-grade and lowest-cost open-pit precious metals mines, with significant silver by-product production that exceeds the output of many primary silver mines. Skeena is committed to responsible and sustainable mining in partnership with Indigenous communities, while maximizing the value of its mineral resources to generate long-term shareholder returns.
This Report covers the Price Action, Technical Indicators Analysis along with the Support Levels, Resistance Levels, and Recommendations on this stock.

- Capital Structure Reset Unlocks Value: Skeena Resources Limited has replaced a complex project financing package with a single USD 750 mn notes issuance. This simplifies the balance sheet and removes layered obligations like the term loan and cost overrun facility. A cleaner structure typically reduces financing friction and improves investor confidence. It also gives management more flexibility in capital allocation.
- Higher Gold Price Exposure: The buyback of 66.67% of the gold stream significantly increases Skeena’s exposure to gold prices. Previously, a portion of production was locked at just 10% of market prices. Now, more ounces will be sold at spot prices, directly boosting revenue potential. This is a major lever if gold prices remain healthy or trend higher.
- Margin Expansion Potential: Streaming agreements tend to suppress margins over the life of mine. By buying back a large portion early, Skeena reduces long-term revenue leakage. This should translate into better operating margins once production begins. The impact compounds over time as production ramps up.
- Fully Funded Path to Production: The company has allocated USD ~470 mn toward construction at the Eskay Creek Project. This reduces funding uncertainty, which is a key overhang for pre-production miners. With capital largely secured, execution risk becomes more manageable. Investors typically reward projects that are fully financed.

- Execution Risk: The company is still in the construction phase. Delays or cost overruns at Eskay Creek could impact timelines and returns.
- Commodity Price Volatility: While gold exposure has increased, earnings will now be more sensitive to gold price fluctuations.
- Pre-Revenue Status: Until production begins, the company relies entirely on capital markets and reserves. This increases financial vulnerability.
- Single Asset Concentration: Skeena is heavily dependent on Eskay Creek. Any operational issue at the project could materially impact valuation.

SKE is trading around CAD 40 and is in a corrective phase after peaking near CAD 50 - 52. The stock is stabilising around the CAD 38 - 40 support zone, suggesting potential base formation. RSI near 40 indicates subdued momentum with room for recovery. This is a buy-on-dips, with upside confirmation above CAD 44 - 46.
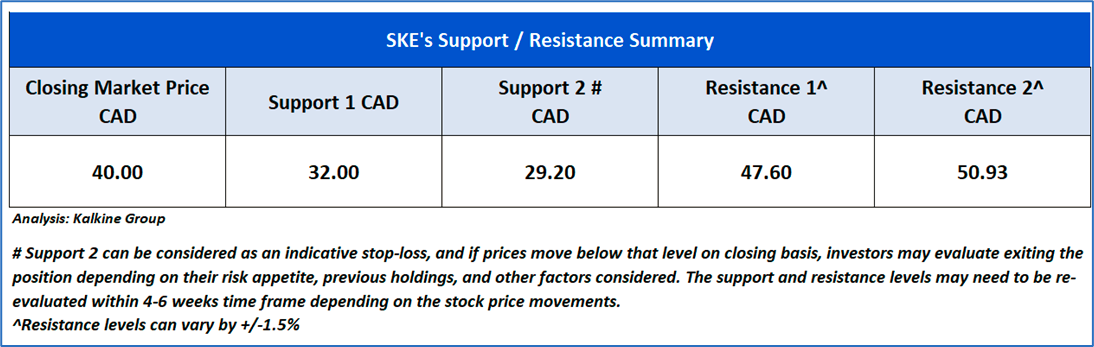


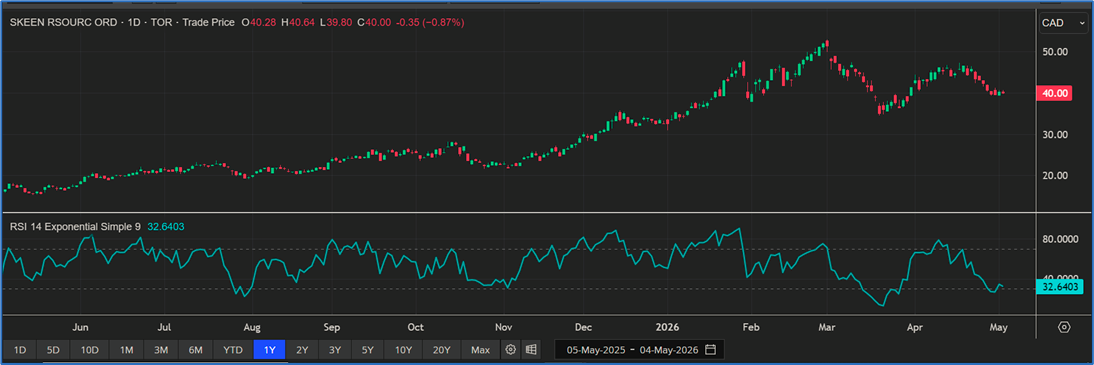
SKE’s, 1 Year Technical Price Chart, Source: REFINITIV; Analysis: Kalkine Group

As per the above-mentioned price action and technical indicators analysis, a ‘Speculative Buy’ rating has been given Skeena Resources Limited (TSX: SKE) at the closing market price of CAD 40.00, as of May 04, 2026.
Note 1: Past performance is not a reliable indicator of future performance.
Note 2: The reference date for all price data, currency, technical indicators, support, and resistance levels as on May 04, 2026. The reference data in this report has been partly sourced from REFINITIV.
Note 3: Investment decisions should be made depending on an individual's appetite for upside potential, risks, holding duration, and any previous holdings. An 'Exit' from the stock can be considered if the Target Price mentioned as per the Valuation and or the technical levels provided has been achieved and is subject to the factors discussed above.
Note 4: Dividend Yield may vary as per the stock price movement.
Note 5: Kalkine reports are prepared based on the stock prices captured either from REFINITIV or Trading View. Typically, REFINITIV or Trading View may reflect stock prices with a delay which could be a lag of 25-30 minutes. There can be no assurance that future results or events will be consistent with the information provided in the report. The information is subject to change without any prior notice.
Technical Indicators Defined: -
Support: A level at which the stock prices tend to find support if they are falling, and a downtrend may take a pause backed by demand or buying interest.
Resistance: A level at which the stock prices tend to find resistance when they are rising, and the uptrend may take a pause due to profit booking or selling interest.
Stop-loss: In general, it is a level to protect further losses in case of any unfavourable movement in the stock prices.

 NZ
 UK
 US
 AU
 IND

 CA

 Please wait processing your request...