SSR Mining Inc
SSR Mining Inc. (NASDAQ: SSRM) and its subsidiaries is a precious metals mining company with four assets located in the United States, Turkiye, Canada and Argentina. The Company is primarily engaged in the operation, acquisition, exploration and development of precious metal resource properties located in Turkiye and the Americas. The Company produces gold dore as well as copper, silver, lead and zinc concentrates.

Key Business and Financial Updates:
- Strong Free Cash Flow Generation and Balance Sheet Strength: SSR Mining (SSRM) delivered robust cash flow performance, generating USD 100 million in Q4 and USD 252 million for FY2025, with underlying free cash flow exceeding USD 400 million excluding working capital adjustments. The company ended the year with a strong liquidity position of USD 535 million in cash and over USD 1 billion in total liquidity, providing significant financial flexibility to fund growth initiatives while maintaining shareholder returns.
- Capital Allocation and Shareholder Returns: Reflecting confidence in its financial position and valuation, SSR Mining announced a USD 300 million share repurchase program, reintroducing buybacks as a key capital allocation lever. The company has a proven track record, having repurchased 20 million shares between 2021 and 2024 at an average price of USD 15.76, reinforcing its commitment to enhancing shareholder value alongside reinvestment in high-return projects.
- Production Performance and Cost Profile: Operationally, SSRM delivered 447,000 gold equivalent ounces in FY2025, exceeding guidance, with Q4 production of 120,000 ounces at an AISC of USD 2,150 per ounce. Asset-level performance remained strong, particularly at Marigold (43,000 oz, AISC USD 2,089) and Cripple Creek & Victor (39,000 oz, AISC USD 1,596). While costs trended toward the higher end of guidance due to royalties and inflationary pressures, underlying AISC excluding Çöpler remained well-controlled at USD 1,923 per ounce, highlighting operational discipline.
- Growth Pipeline and Asset Quality: The company significantly strengthened its long-term asset base, with mineral reserves increasing to 11 million gold equivalent ounces (+~40% YoY), supported by the inclusion of Hod Maden and CC&V. The Hod Maden project stands out with a USD 1.7 billion NPV and 39% IRR, alongside expected average annual free cash flow of USD 328 million, while the CC&V technical report outlines a 12-year mine life with USD 824 million NPV and substantial resource upside. These assets underpin long-duration, high-margin growth potential.
- Outlook and Strategic Positioning for 2026: Looking ahead, SSR Mining expects 2026 production of 450,000–535,000 gold equivalent ounces with consolidated AISC guidance of USD 2,360–2,440 per ounce, alongside USD 150 million in growth capex focused on expansion and exploration. Strong contributions are anticipated from Marigold, CC&V, Seabee, and Puna, with production weighted toward the second half of the year. Despite ongoing costs related to Çöpler care and maintenance, SSRM remains well-positioned with a diversified asset base, strong free cash flow outlook, and a disciplined capital allocation strategy, supporting both growth and shareholder returns.
Key Company specific risks for SSRM:
- Commodity Price Volatility and Revenue Sensitivity: SSR Mining’s financial performance is highly sensitive to fluctuations in gold and silver prices, which directly influence revenue, margins, and cash flow. A significant portion of earnings is derived from precious metals, and recent declines in gold and silver prices have already led to notable stock price corrections and earnings pressure. This inherent exposure creates earnings volatility, particularly in periods of tightening monetary policy or weakening global demand for safe-haven assets.
- Operational and Regulatory Uncertainty: The company faces operational and regulatory risks across key assets, particularly highlighted by the ongoing Çöpler mine situation, which remains on care and maintenance pending regulatory approvals. Delays in approvals, environmental compliance requirements, or unforeseen operational disruptions can materially impact production and cost structure. Additionally, mining operations are exposed to geopolitical, environmental, and permitting risks, which may affect project timelines and future expansion plans.
- High Beta to Macro and Market Downturns: SSR Mining exhibits elevated sensitivity to macroeconomic shocks, with historical data showing that the stock has experienced significantly larger drawdowns than broader equity markets during crises. For instance, in periods of credit and liquidity stress, SSRM has declined materially more than benchmark indices, reflecting its high beta nature. This makes the stock particularly vulnerable during economic downturns, tightening liquidity conditions, or broader risk-off market environments.
Technical Observation (on the daily chart):
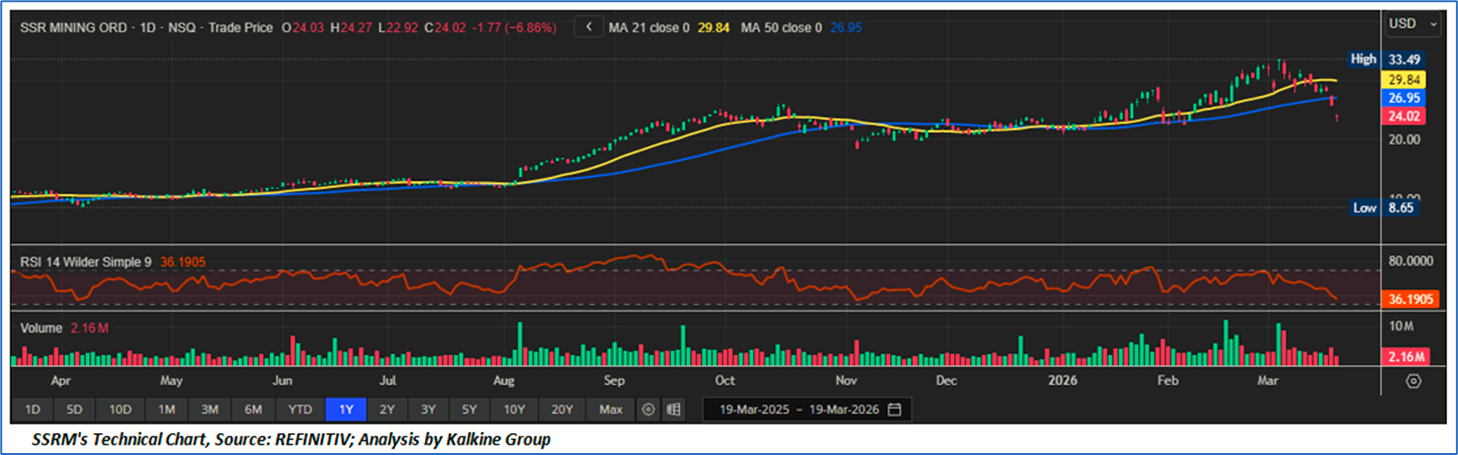
- Price Trend and Moving Average Structure: SSR Mining (SSRM) has recently transitioned from a strong upward trend into a corrective phase, following a rally that peaked near USD 33.49. The stock is currently trading around USD 24.02, reflecting a notable pullback. Importantly, price has broken below both the 21-day moving average (USD 29.84) and the 50-day moving average (USD 26.95), indicating a weakening short-term and intermediate trend. The downward crossover and widening gap between price and moving averages suggest a shift toward bearish momentum, with near-term trend pressure remaining intact unless key levels are reclaimed.
- Momentum Indicators and Relative Strength: Momentum indicators reinforce the softening technical outlook, with the Relative Strength Index (RSI) positioned near 36, indicating weakening momentum but not yet deeply oversold. This suggests that while selling pressure has increased, there remains room for further downside before reaching extreme oversold conditions. The absence of bullish divergence indicates that the current decline is trend-driven rather than exhaustion-driven, implying that any near-term bounce may be limited unless supported by broader market strength.
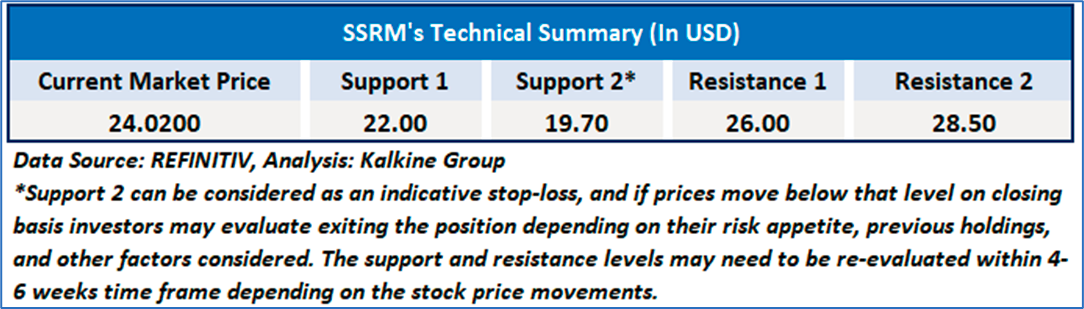
- Support, Resistance, and Volume Analysis: From a key levels perspective, immediate support is observed around the USD 22–USD 24 zone, with a breakdown potentially exposing lower levels toward the USD 20 range. On the upside, the USD 26.95–USD 29.84 band (50DMA and 21DMA) now acts as a strong resistance zone, and a sustained move above this range would be required to restore bullish sentiment. Volume patterns show increased selling activity during the recent decline, indicating distribution rather than accumulation. Overall, the technical structure suggests a short-term bearish bias with potential for consolidation, pending confirmation of support stability or a reversal above key moving averages.
SSR Mining (SSRM) presents a compelling investment profile supported by robust free cash flow generation, a strong balance sheet, and a high-quality, diversified asset portfolio. The company delivered USD 252 million in FY2025 free cash flow (over USD 400 million underlying) and maintains over USD 1 billion in liquidity, enabling both growth investments and shareholder returns, including a newly approved USD 300 million buyback program. Operationally, SSRM exceeded production guidance with 447,000 gold equivalent ounces, while maintaining cost discipline across key assets such as Marigold and CC&V. The company’s ~40% increase in mineral reserves to 11 million ounces, alongside high-value projects like Hod Maden (USD 1.7 billion NPV, 39% IRR) and CC&V, provides strong long-term growth visibility. With a clear focus on brownfield expansion, disciplined capex, and rising exposure to favorable gold and silver markets, SSRM is well-positioned to deliver sustainable cash flows, asset growth, and enhanced shareholder value despite near-term operational and macro risks.
As per the above-mentioned price action, important support near USD22.00- USD 24.00, momentum in the stock over the last month, and technical indicators analysis, a ‘Buy’ rating has been given for SSR Mining Inc. (NASDAQ: SSRM), at the current price of USD 24.02, as of March 19, 2026, at 07:40 am PDT.
Individuals can evaluate the stock based on the support and resistance levels provided in the report in case of keen interest taking into consideration the risk-reward scenario.
Markets are trading in a highly volatile zone currently due to certain macro-economic issues and prevailing geopolitical tensions. Therefore, it is prudent to follow a cautious approach while investing.
Related Risk: This report may be looked at from a high-risk perspective, and a recommendation is provided for a short duration. This report is solely based on technical parameters, and the fundamental performance of the stocks has not been considered in the decision-making process. Other factors which could impact the stock prices include market risks, regulatory risks, interest rates risks, currency risks, social and political instability risks etc.
Note 1: Past performance is not a reliable indicator of future performance.
Note 2: The reference date for all price data, currency, technical indicators, support, and resistance level is March 19, 2026. The reference data in this report has been partly sourced from REFINITIV.
Note 3: Investment decisions should be made depending on an individual's appetite for upside potential, risks, holding duration, and any previous holdings. An 'Exit' from the stock can be considered if the Target Price mentioned as per the Valuation and or the technical levels provided has been achieved and is subject to the factors discussed above.
Note 4: Target Price refers to a price level that the stock is expected to reach as per the relative valuation method and or technical analysis taking into consideration both short-term and long-term scenarios.
Note 5: ‘Kalkine reports are prepared based on the stock prices captured either from the New York Stock Exchange (NYSE), NASDAQ Capital Markets (NASDAQ), and or REFINITIV. Typically, all sources (NYSE, NASDAQ, or REFINITIV) may reflect stock prices with a delay which could be a lag of 15-20 minutes. There can be no assurance that future results or events will be consistent with the information provided in the report. The information is subject to change without any prior notice.

 NZ
 UK
 US
 AU
 IND

 CA

 Please wait processing your request...