Company Overview: Neogen Corporation (NASDAQ: NEOG) is a global provider of food safety and animal health solutions, serving customers across the food production, processing, and animal protein value chain. The company operates through two core segments: Food Safety, which offers diagnostic and testing solutions to detect contaminants and pathogens in food and beverages, and Animal Safety, which provides products focused on animal health, genomics, and veterinary diagnostics.

Recent Earnings & Fundamental Update
Neogen delivered a notable earnings beat in its most recent quarter (ended November 30, 2025), reinforcing the narrative that the company is stabilising after a challenging integration and portfolio transition phase.
Key Financial Highlights
- Adjusted EPS: $0.10, beating consensus expectations of $0.03
- Revenue: $224.7 million, above estimates of $208.12 million
- YoY Revenue Change: –2.8% (vs. $231.3 million last year)
- Core Revenue Growth: +2.9% YoY (excluding FX and divestitures)
Despite headline revenue decline, the core business showed sequential improvement, signalling that the underlying demand environment remains intact.
Segment Performance
- Food Safety Revenue: $165.6 million (+0.8% YoY)
Stable demand, reinforcing Neogen’s strength in food diagnostics.
- Animal Safety Revenue: $59.1 million (–11.8% YoY)
Decline largely driven by divestitures and discontinued product lines rather than demand weakness.
Profitability
- Adjusted EBITDA: $48.7 million
- EBITDA Margin: 21.7% (vs. 22.2% last year)
Margins softened slightly but remained resilient given macro headwinds and ongoing operational transitions.
Management commentary was constructive, with CEO Mike Nassif emphasising early progress in Neogen’s strategic transformation, focusing on stabilisation, core growth, and profitability improvements. Importantly, the Petrifilm manufacturing transition remains on track, reducing execution risk going forward.
Technical Commentary (Daily Chart Analysis):
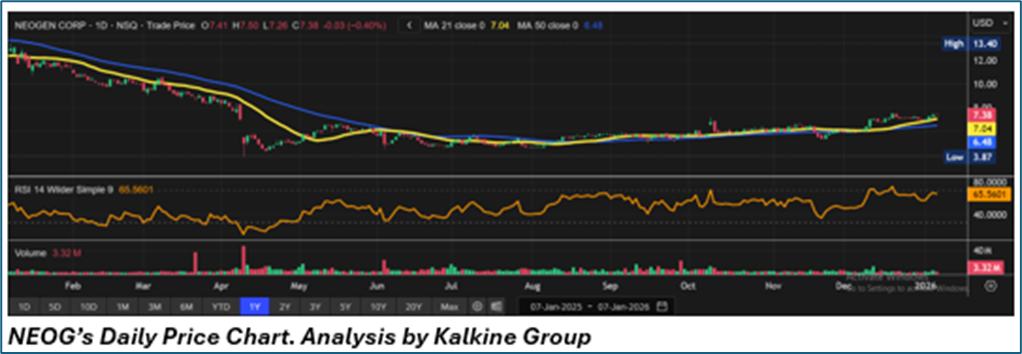
NEOG has been in a base-building phase following a prolonged downtrend, with price action forming a series of higher lows since mid-2025, signalling accumulation rather than distribution. The stock is now attempting to transition from consolidation into a potential trend-reversal phase.
Technically, price is trading above the 20- and 50-day EMAs, indicating improving near-term momentum, while the 100-day EMA has been reclaimed and is acting as intermediate support. The 200-day EMA around $7.00–$7.05 remains the key long-term resistance and structural pivot; a sustained breakout above this zone would materially improve the broader technical outlook.
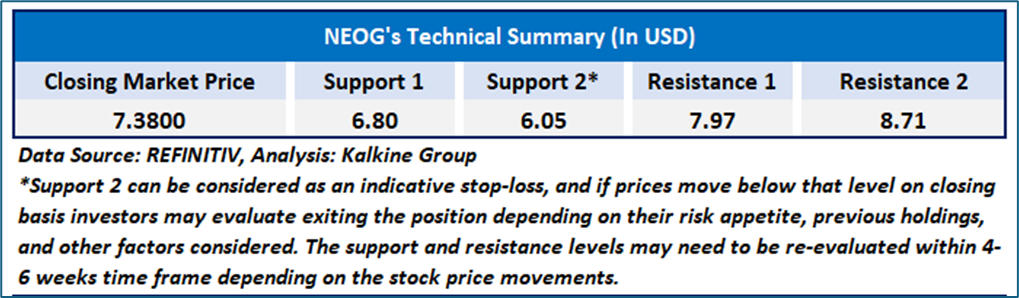
Momentum indicators are constructive, with the 14-day RSI hovering in the mid-60s, reflecting bullish strength but also suggesting the stock is nearing short-term overbought levels, making consolidation healthy. Volume expansion on recent advances appears measured and institutional in nature. Key supports lie at $7.00–$7.05, $6.60–$6.65, and $6.35, while resistance is seen at $7.50–$7.80, $8.20–$8.50, and above $9.00.

Conclusion
Neogen Corporation appears to be at an inflection point, with improving fundamentals beginning to align with a strengthening technical setup. The recent earnings beat, stabilising core revenues, and resilient margins suggest early success in management’s turnaround efforts, while the reclaiming of key moving averages indicates rising market confidence and reduced execution risk. Technically, the stock is emerging from a prolonged consolidation phase and challenging its long-term trend barrier near the $7.00–$7.05 zone. While macro headwinds persist and execution risk remains, sustained price action above this level would support a broader trend reversal. Based on the above rationale a “Speculative Buy” rating at the closing price of USD 7.38 as of January 07, 2026.
Individuals can evaluate the stock based on the support and resistance levels provided in the report in case of keen interest taking into consideration the risk-reward scenario.
Markets are trading in a highly volatile zone currently due to certain macro-economic issues and prevailing geopolitical tensions. Therefore, it is prudent to follow a cautious approach while investing.
Related Risk: This report may be looked at from a high-risk perspective, and a recommendation is provided for a short duration. This report is solely based on technical parameters, and the fundamental performance of the stocks has not been considered in the decision-making process. Other factors which could impact the stock prices include market risks, regulatory risks, interest rates risks, currency risks, social and political instability risks etc.
Note 1: Past performance is not a reliable indicator of future performance.
Note 2: The reference date for all price data, currency, technical indicators, support, and resistance level is January 07, 2026. The reference data in this report has been partly sourced from REFINITIV.
Note 3: Investment decisions should be made depending on an individual's appetite for upside potential, risks, holding duration, and any previous holdings. An 'Exit' from the stock can be considered if the Target Price mentioned as per the Valuation and or the technical levels provided has been achieved and is subject to the factors discussed above.
Note 4: Target Price refers to a price level that the stock is expected to reach as per the relative valuation method and or technical analysis taking into consideration both short-term and long-term scenarios.
Note 5: ‘Kalkine reports are prepared based on the stock prices captured either from the New York Stock Exchange (NYSE), NASDAQ Capital Markets (NASDAQ), and or REFINITIV. Typically, all sources (NYSE, NASDAQ, or REFINITIV) may reflect stock prices with a delay which could be a lag of 15-20 minutes. There can be no assurance that future results or events will be consistent with the information provided in the report. The information is subject to change without any prior notice.

 NZ
 UK
 US
 AU
 IND

 CA

 Please wait processing your request...