Company Overview:
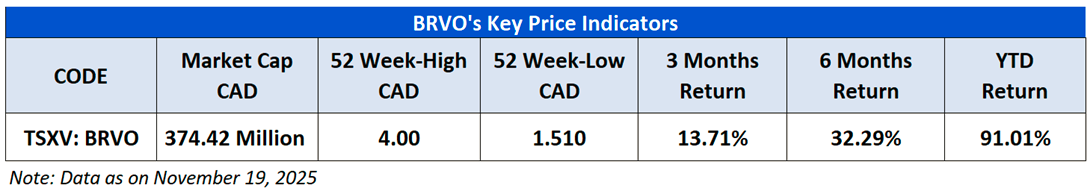
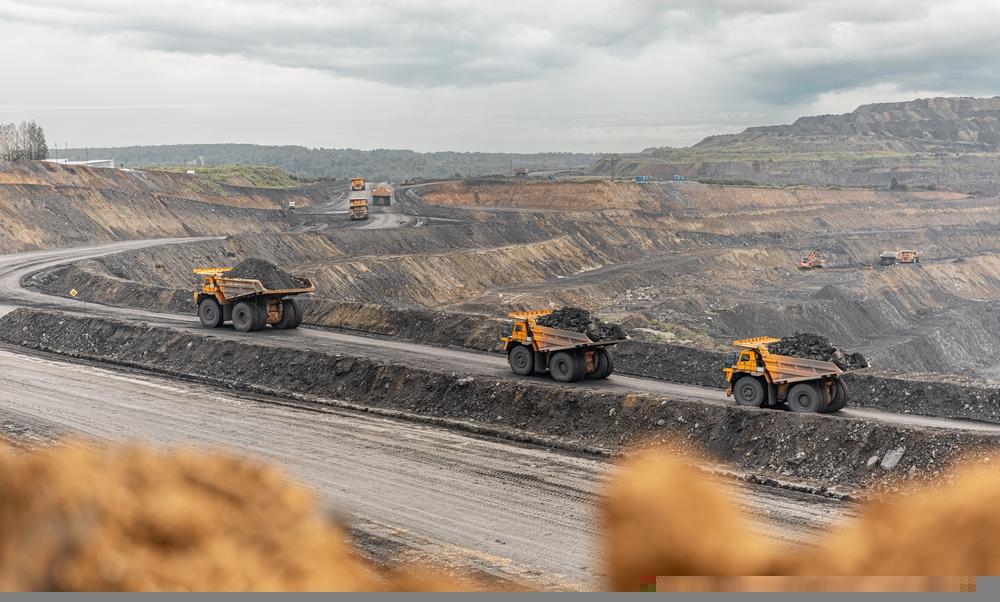
Bravo Mining Corp. (TSXV: BRVO) is an intermediate-stage mineral exploration company focused on the exploration and development of the Luanga Project. The Luanga Project is an intermediate-stage PGE including palladium, platinum, rhodium, gold, and nickel exploration project located in Carajss, Para State, Brazil.
This Report covers the Price Action, Technical Indicators Analysis along with the Support Levels, Resistance Levels, and Recommendations on this stock.
Fundamental Highlights:
Strategic Vertical Integration Enabled by New Export Zone: The approval of the Barcarena Export Processing Zone positions Bravo as its anchor company, advancing the Luanga Project’s vertical-integration pathway. This designation supports potential downstream refining with significant tax and logistical advantages, enhancing project economics and strengthening Bravo’s role in Brazil’s growing critical-minerals sector.
BRVO’s Technical Observation:
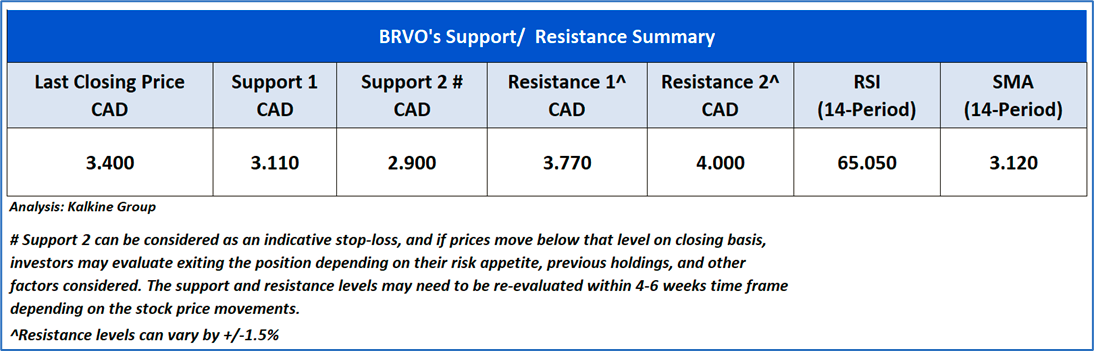
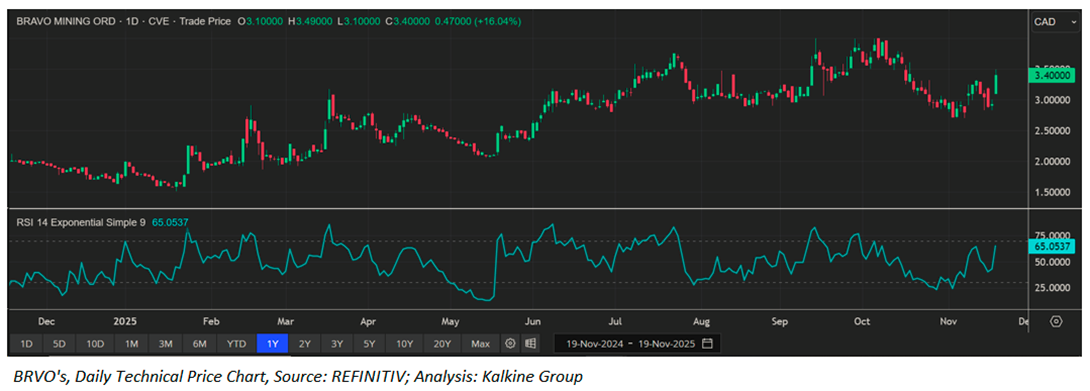
The daily price chart of Bravo Mining is turning upward after a prolonged downtrend, with price reclaiming the 14-period SMMA around CAD 3.12 and pushing to CAD 3.40. Momentum has improved as RSI rebounds from oversold levels into the mid-60s, indicating strengthening bullish sentiment and a potential short-term trend reversal.
BRVO’s Daily Price Chart
As per the above-mentioned price action and technical indicators analysis, a ‘Speculative Buy’ rating has been given Bravo Mining Corp. (TSXV: BRVO) at the last closing price of CAD 3.40, as of 19th November 2025. Individuals can evaluate the stock based on the support and resistance levels provided in the report in case of keen interest taking into consideration the risk-reward scenario.
Markets are trading in a highly volatile zone currently due to certain Macro & Micro-economic data and prevailing geopolitical tensions. Therefore, it is prudent to follow a cautious approach while investing.
Note 1: Past performance is not a reliable indicator of future performance.
Note 2: The reference date for all price data, currency, technical indicators, support, and resistance levels as on November 19, 2025. The reference data in this report has been partly sourced from REFINITIV.
Note 3: Investment decisions should be made depending on an individual's appetite for upside potential, risks, holding duration, and any previous holdings. An 'Exit' from the stock can be considered if the Target Price mentioned as per the Valuation and or the technical levels provided has been achieved and is subject to the factors discussed above.
Note 4: Dividend Yield may vary as per the stock price movement.
Note 5: Kalkine reports are prepared based on the stock prices captured either from REFINITIV or Trading View. Typically, REFINITIV or Trading View may reflect stock prices with a delay which could be a lag of 25-30 minutes. There can be no assurance that future results or events will be consistent with the information provided in the report. The information is subject to change without any prior notice.
Technical Indicators Defined: -
Support: A level at which the stock prices tend to find support if they are falling, and a downtrend may take a pause backed by demand or buying interest.
Resistance: A level at which the stock prices tend to find resistance when they are rising, and the uptrend may take a pause due to profit booking or selling interest.
Stop-loss: In general, it is a level to protect further losses in case of any unfavourable movement in the stock prices.
 Please wait processing your request...