Blue Owl Capital Inc
Blue Owl Capital Inc (NYSE: OWL) is an alternative investment manager that allocates private capital across its Credit, GP Strategic Capital, and Real Estate platforms for both institutional and private wealth investors. The company’s offerings span multiple product strategies, with its Credit platform providing tailored private financing solutions primarily to upper-middle-market businesses.

- Record Fundraising Momentum Driving Platform Expansion
- Broad-Based Capital Inflows Across Channels: Blue Owl Capital delivered a landmark year in fundraising performance, with total equity capital raised reaching USD 42.0 billion in 2025, representing an increase of more than 50% compared with the prior year. Institutional fundraising was particularly robust, rising 80% year-over-year to USD 24.7 billion, while private wealth-focused products recorded a 58% increase in fundraising activity.
- The firm also achieved significant milestones across its product suite, including the successful first close of Blue Owl Digital Infrastructure Trust II at USD 1.7 billion, the rapid scaling of OWLCX beyond USD 1.25 billion in its launch year, and the completion of Blue Owl Digital Infrastructure Fund III at its USD 7 billion hard cap.
- Strong Investment Performance Across Core Strategies
- Consistent Returns in Credit, Real Assets, and GP Capital: Blue Owl’s investment platforms generated solid performance across asset classes in 2025, reinforcing client confidence and supporting continued asset inflows. Within Credit, flagship strategies delivered double-digit gross returns, including 10.1% for OCIC and 11.0% for OTIC, while Atalaya Special Opportunities Fund VIII produced an 18.8% gross internal rate of return.
- Real Assets strategies also exhibited strength, with Blue Owl Real Estate Fund IV generating a 17.8% gross IRR and the Digital Infrastructure Fund achieving a 15.1% gross IRR. GP Strategic Capital emerged as a standout contributor, as Blue Owl GP Stakes III delivered a 28.3% gross IRR, reflecting the effectiveness of the firm’s minority ownership model in alternative asset managers.
- Accelerating Revenue Growth Supported by Scaled Fee Base
- Expansion of Management Fees and Performance Revenues: On a GAAP basis, Blue Owl reported consolidated revenues of USD 2.87 billion for FY2025, representing a 25% increase over the prior year. Management fees grew 26% to USD 2.52 billion, reflecting higher fee-paying assets and continued expansion of permanent capital vehicles.
- Performance revenues also surged sharply, rising more than 270% year-over-year, benefiting from strong investment realizations across multiple strategies. Growth was particularly pronounced in the Real Assets segment, where revenues more than doubled, underscoring the increasing contribution of infrastructure and net lease platforms to the overall revenue mix.
- Earnings Growth on an Adjusted Basis Despite GAAP Volatility
- Rising Fee-Related and Distributable Earnings: On a non-GAAP basis, Blue Owl continued to demonstrate strong underlying earnings momentum. Fee-Related Earnings increased 19% year-over-year to USD 1.50 billion, while Distributable Earnings rose 16% to USD 1.31 billion, reflecting scalable operating leverage across the platform.
- FRE revenues expanded 22% to USD 2.65 billion, supported by rising management fees and improved performance income, while margins remained elevated at approximately 58–61%, highlighting the efficiency of the firm’s asset-light business model.
- Significant Growth in Assets Under Management and Permanent Capital
- AUM Surpasses USD 300 Billion Milestone: Total assets under management increased 22% year-over-year to USD 307.4 billion, driven primarily by strong fundraising activity and the integration of the IPI acquisition. Fee-paying AUM reached USD 187.7 billion, while permanent capital expanded 16% to USD 222.8 billion, accounting for approximately 85% of fee-related management revenues.
- In addition, USD 28.4 billion of capital not yet generating fees provides a visible pipeline for future revenue growth, with expected annual management fees of roughly USD 326 million once fully deployed.
- Platform-Level Operational Execution and Deployment Strength
- Active Capital Deployment and Origination Activity: Operationally, Blue Owl maintained high levels of investment activity across platforms. The Credit segment recorded direct lending originations of USD 45.4 billion during 2025, with net deployment of USD 13.2 billion, reflecting sustained borrower demand across private credit markets.
- Real Assets and GP Strategic Capital continued expanding their asset bases through infrastructure investments, net lease portfolios, and minority equity stakes in alternative managers, reinforcing long-term fee visibility and diversification of revenue streams.
- Shareholder Returns and Capital Management Discipline
- Dividends and Share Repurchases: Blue Owl complemented its growth strategy with disciplined capital returns to shareholders. The company declared an annual dividend of USD 0.92 per Class A share for 2026, including a USD 0.225 quarterly dividend for the fourth quarter.
- Additionally, the firm repurchased 3.6 million shares during the quarter for USD 52.0 million, demonstrating confidence in cash flow generation and long-term earnings durability.
Key Risks:
- Fundraising Sensitivity to Market Cycles: A prolonged downturn in credit markets or risk appetite could slow capital inflows, directly impacting AUM growth and future fee generation.
- Deployment and Return Execution Risk: Delays in deploying large pools of committed capital or weaker-than-expected investment performance could pressure performance revenues and investor confidence.
- Regulatory and Compliance Exposure: Heightened scrutiny of alternative asset managers and changes in financial regulations may increase operating costs or constrain certain investment strategies.
- Concentration in Permanent Capital Structures: Heavy reliance on permanent capital vehicles, while stabilizing fees, may expose earnings to valuation swings during periods of market stress.
Technical Observation (on the daily chart):
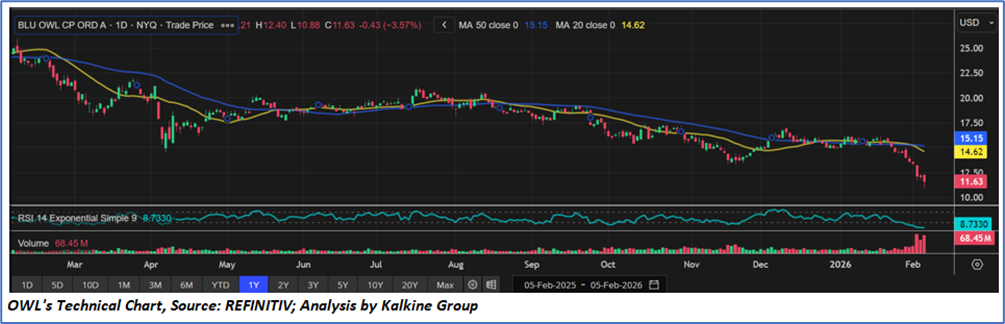
- The stock remains in a clear medium-term downtrend, trading consistently below the 20-day and 50-day moving averages, both of which are sloping downward; signaling sustained bearish momentum.
- Repeated failures to break above these moving averages suggest recent price rebounds have been corrective pullbacks rather than trend reversals.
- The RSI is positioned near oversold territory, indicating strong selling pressure and weak bullish participation, with limited signs of momentum recovery.
- The latest decline toward the USD 11–12 range occurred on heightened trading volume, pointing to active distribution rather than a temporary sell-off.
Blue Owl Capital delivered a strong and scalable performance in 2025, marked by record fundraising, robust investment returns, and meaningful growth in fee-generating assets. The firm surpassed USD 300 billion in assets under management, driven by broad-based capital inflows across institutional and private wealth channels, while expanding its permanent capital base that underpins stable, recurring revenues. Financially, management fees and adjusted earnings rose at double-digit rates, supported by operating leverage and strong deployment activity across Credit, Real Assets, and GP Strategic Capital platforms. Coupled with disciplined capital returns through dividends and share repurchases, Blue Owl’s results reflect a resilient business model with durable cash flows and clear momentum for sustained long-term expansion.
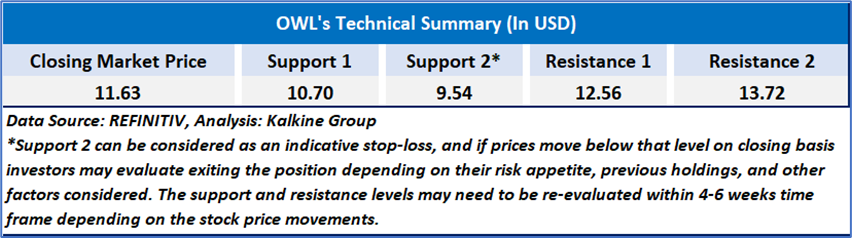
Supported by a growing customer base, strengthening balance sheet, and sustained earnings momentum, a ‘Buy’ rating has been given Blue Owl Capital Inc (NYSE: OWL) at the closing market price of USD 11.63 as of Feb 05,2026.
Individuals can evaluate the stock based on the support and resistance levels provided in the report in case of keen interest taking into consideration the risk-reward scenario.
Markets are trading in a highly volatile zone currently due to certain macro-economic issues and prevailing geopolitical tensions. Therefore, it is prudent to follow a cautious approach while investing.
Related Risk: This report may be looked at from a high-risk perspective and a recommendation is provided for a short duration. This report is solely based on technical parameters, and the fundamental performance of the stocks has not been considered in the decision-making process. Other factors which could impact the stock prices include market risks, regulatory risks, interest rates risks, currency risks, social and political instability risks etc.
Note 1: Past performance is not a reliable indicator of future performance.
Note 2: The reference date for all price data, currency, technical indicators, support, and resistance level is February 05,2026. The reference data in this report has been partly sourced from REFINITIV.
Note 3: Investment decisions should be made depending on an individual's appetite for upside potential, risks, holding duration, and any previous holdings. An 'Exit' from the stock can be considered if the Target Price mentioned as per the Valuation and or the technical levels provided has been achieved and is subject to the factors discussed above.
Note 4: Target Price refers to a price level that the stock is expected to reach as per the relative valuation method and or technical analysis taking into consideration both short-term and long-term scenarios.
Note 5: ‘Kalkine reports are prepared based on the stock prices captured either from the New York Stock Exchange (NYSE), NASDAQ Capital Markets (NASDAQ), and or REFINITIV. Typically, all sources (NYSE, NASDAQ, or REFINITIV) may reflect stock prices with a delay which could be a lag of 15-20 minutes. There can be no assurance that future results or events will be consistent with the information provided in the report. The information is subject to change without any prior notice.

 NZ
 UK
 US
 AU
 IND

 CA

 Please wait processing your request...