HDFC Bank Limited
HDFC Bank Limited (NYSE: HDB) is a private sector bank that provides a wide range of banking and financial services through segments including treasury, retail banking, wholesale banking, and other banking operations. Its treasury segment manages investment portfolios and money market activities, while retail banking focuses on digital and consumer banking services. The wholesale banking segment serves corporates, government entities, and institutions through lending and transaction services, while other banking operations include parabanking activities such as credit cards, debit cards, and third-party financial product distribution.

Revenue Growth and Earnings Momentum
- Net Revenue Expansion Driven by Interest and Fee Income: HDFC Bank reported steady revenue expansion during Q3FY26, reflecting continued growth in both interest and non-interest income streams. Net revenues increased to INR 458.7 billion in the quarter ended December 31, 2025, representing an 8.9% increase compared with INR 421.1 billion in Q3FY25. The improvement in revenue generation was supported by higher lending volumes, expansion in deposit balances, and continued growth in fee-based businesses across retail and wholesale banking segments.
- Growth in Net Interest Income and Stable Margins: Net interest income (NII) increased to INR 326.2 billion during Q3FY26 from INR 306.5 billion in the corresponding quarter of the previous year, representing growth of 6.4%. The Bank maintained a core net interest margin of 3.35% based on total assets, reflecting stable lending spreads despite a competitive funding environment. The sustained expansion in NII was supported by growth in advances and stable asset yields across key lending segments.
- Expansion in Non-Interest Income: Other income contributed INR 132.5 billion during the quarter, supported by strong growth in fee and commission income, which rose to INR 92.3 billion from INR 81.8 billion in Q3FY25. Foreign exchange and derivative revenues remained stable at INR 14.3 billion, while trading and mark-to-market gains increased significantly to INR 9.3 billion compared with INR 0.7 billion in the previous year. These trends reflect diversification in revenue streams beyond traditional lending activities.
Profitability and Cost Efficiency
- Controlled Operating Expenses and Cost Management: Operating expenses for the quarter stood at INR 187.7 billion. Excluding the estimated impact of INR 8.0 billion related to employee benefits under the new labour code, operating expenses were INR 179.7 billion compared with INR 171.1 billion in Q3FY25. The Bank maintained operational discipline, resulting in a core cost-to-income ratio of 39.2%, reflecting continued efficiency despite branch expansion and investments in technology and human resources.
- Profit Growth Supported by Lower Provisions: Provisions and contingencies totaled INR 28.4 billion during Q3FY26, reflecting a reduction compared with the prior year due to the release of contingent provisions related to a large borrower group. The lower provisioning requirement contributed to improved profitability, with profit before tax reaching INR 242.6 billion. Profit after tax increased to INR 186.5 billion, representing a year-on-year growth of 11.5%.
Balance Sheet Expansion and Deposit Growth
- Strong Deposit Mobilisation and CASA Stability: The Bank continued to strengthen its liability franchise during the quarter. Average deposits increased to INR 27,524 billion, representing a 12.2% increase compared with INR 24,528 billion in Q3FY25. End-of-period deposits stood at INR 28,601 billion, reflecting growth of 11.6% year-on-year. CASA deposits also increased by 10.1%, with savings deposits reaching INR 6,617 billion and current account balances at INR 2,995 billion, highlighting the continued strength of the Bank’s low-cost funding base.
- Loan Growth Supported by Retail and SME Segments: Average advances under management increased to INR 28,641 billion during the quarter, representing growth of 9.0% year-on-year. Gross advances reached INR 28,446 billion as of December 31, 2025, reflecting growth of 11.9% over the prior year. Retail loans grew by 6.9%, small and mid-market enterprise loans increased by 17.2%, and corporate and wholesale loans expanded by 10.3%, indicating balanced growth across lending segments.
Asset Quality and Risk Management
- Stable Non-Performing Asset Ratios: Asset quality remained resilient during Q3FY26. Gross non-performing assets were maintained at 1.24% of gross advances, while net non-performing assets stood at 0.42% of net advances. Excluding the agricultural segment, the gross NPA ratio stood at 0.97%, reflecting disciplined underwriting standards and prudent risk management practices.
- Strong Capital Position and Liquidity: The Bank continued to maintain a strong capital position. The total capital adequacy ratio under Basel III guidelines stood at 19.9% as of December 31, 2025, significantly above the regulatory requirement of 11.9%. The Tier 1 capital ratio was 17.8%, while the common equity Tier 1 ratio stood at 17.4%, providing adequate capital buffers to support future balance sheet growth and absorb potential economic shocks.
Distribution Network Expansion and Franchise Strength
- Expansion in Branch Network and Workforce: HDFC Bank continued expanding its distribution footprint to enhance customer reach and deepen market penetration. As of December 31, 2025, the Bank operated 9,616 branches and 21,176 ATMs across 4,170 cities and towns compared with 9,143 branches and 21,049 ATMs a year earlier. Approximately half of the branches are located in semi-urban and rural areas, reflecting the Bank’s strategy of expanding into under-penetrated markets.
- Continued Growth in Workforce and Business Correspondent Network: The Bank employed 215,739 employees as of December 31, 2025, compared with 210,219 employees a year earlier. In addition, the Bank maintained a network of 15,216 business correspondents, largely operated through Common Service Centres, which helped expand financial inclusion and extend banking services to rural and semi-urban areas.
Key Risks:
- Margin Pressure from Rising Funding Costs: Sustained competition for deposits and higher interest rates could increase the cost of funds, potentially compressing net interest margins and affecting profitability.
- Asset Quality Deterioration Risk: A slowdown in economic activity or stress in retail, SME, or unsecured lending segments could lead to higher non-performing assets and increased credit costs.
- Regulatory and Compliance Risk: Changes in banking regulations, capital requirements, or RBI policies could affect lending growth, capital allocation, and overall operational flexibility.
- Execution and Integration Risk: Continued balance sheet expansion and integration of businesses following the HDFC Ltd. merger may create operational complexities that could impact efficiency or growth execution.
Technical Observation (on the daily chart):
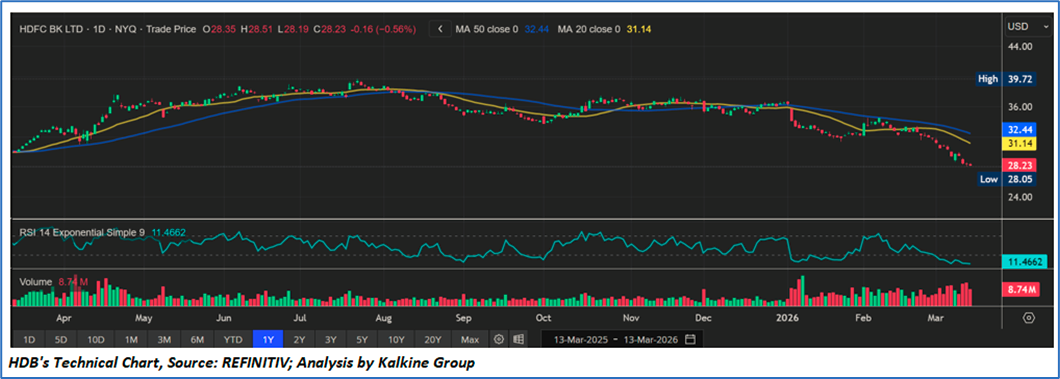
- The stock has entered a clear short-term downtrend, with prices steadily declining since late February and currently trading near the lower end of the recent range around USD 28.2–28.3.
- The price is trading below both the 20-day moving average (USD 31.14) and the 50-day moving average (USD 32.44), indicating weakening momentum and a bearish near-term technical structure. The downward slope of these averages further reinforces selling pressure.
- The RSI is near 11, which signals an extremely oversold condition. While this reflects strong downside momentum, it also suggests the possibility of a short-term technical rebound if buying interest emerges.
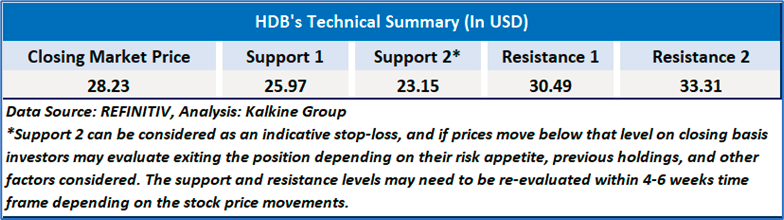
- Support and Resistance Levels: Immediate support appears around USD 28.0, which aligns with the recent low. A sustained break below this level could expose the stock to further downside. On the upside, USD 31–32 represents the first resistance zone near the 20-day and 50-day moving averages.
- Rising trading volumes during the recent decline indicate distribution and increased selling pressure, reinforcing the bearish bias in the short term.
HDFC Bank delivered a stable and broadly positive performance in Q3FY26, supported by steady balance sheet expansion and resilient profitability. Net revenues increased to INR 458.7 billion, driven by a 6.4% rise in net interest income to INR 326.2 billion and continued growth in fee-based income, while profit after tax rose 11.5% year-on-year to INR 186.5 billion. The Bank maintained healthy operating efficiency with a core cost-to-income ratio of 39.2% and stable asset quality, with gross NPAs at 1.24%. Balance sheet momentum remained strong as deposits grew 11.6% year-on-year to INR 28,601 billion and gross advances increased 11.9% to INR 28,446 billion, supported by growth across retail, SME, and corporate lending segments. Overall, the results reflect the Bank’s strong franchise, disciplined risk management, and diversified revenue base, positioning it well for sustained growth.
As per the above-mentioned price action, recent key business and financial updates, and technical indicators analysis, a ‘Buy’ rating has been given to, a ‘Buy’ rating has been given HDFC Bank Limited (NYSE: HDB) at the closing market price of USD 28.23 as of Mar 13,2026.
Individuals can evaluate the stock based on the support and resistance levels provided in the report in case of keen interest taking into consideration the risk-reward scenario.
Markets are trading in a highly volatile zone currently due to certain macro-economic issues and prevailing geopolitical tensions. Therefore, it is prudent to follow a cautious approach while investing.
Related Risk: This report may be looked at from a high-risk perspective and a recommendation is provided for a short duration. This report is solely based on technical parameters, and the fundamental performance of the stocks has not been considered in the decision-making process. Other factors which could impact the stock prices include market risks, regulatory risks, interest rates risks, currency risks, social and political instability risks etc.
Note 1: Past performance is not a reliable indicator of future performance.
Note 2: The reference date for all price data, currency, technical indicators, support, and resistance level is March 13,2026. The reference data in this report has been partly sourced from REFINITIV.
Note 3: Investment decisions should be made depending on an individual's appetite for upside potential, risks, holding duration, and any previous holdings. An 'Exit' from the stock can be considered if the Target Price mentioned as per the Valuation and or the technical levels provided has been achieved and is subject to the factors discussed above.
Note 4: Target Price refers to a price level that the stock is expected to reach as per the relative valuation method and or technical analysis taking into consideration both short-term and long-term scenarios.
Note 5: ‘Kalkine reports are prepared based on the stock prices captured either from the New York Stock Exchange (NYSE), NASDAQ Capital Markets (NASDAQ), and or REFINITIV. Typically, all sources (NYSE, NASDAQ, or REFINITIV) may reflect stock prices with a delay which could be a lag of 15-20 minutes. There can be no assurance that future results or events will be consistent with the information provided in the report. The information is subject to change without any prior notice.

 NZ
 UK
 US
 AU
 IND

 CA

 Please wait processing your request...