Tilray Brands, Inc. (NASDAQ: TLRY)
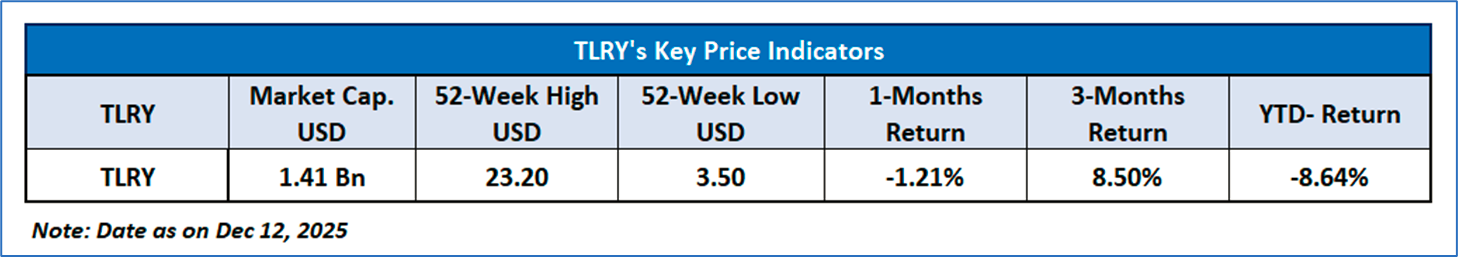
Tilray Brands, Inc. (NASDAQ: TLRY) is a global cannabis-lifestyle and consumer packaged goods company. The Company operates through four segments: Cannabis business, Distribution business, Beverage alcohol business and Wellness business.
Macro Event: Proposed US Cannabis Rescheduling Sparks Broad-Based Rally Across North American Cannabis Stocks
The sharp rally in U.S. and Canadian cannabis stocks reflects growing investor confidence in a potentially transformative regulatory shift, as the anticipated reclassification of marijuana from Schedule I to Schedule III under the U.S. Controlled Substances Act would formally acknowledge its medical use and materially reduce long-standing legal and financial constraints on the industry. The most significant impact would be the effective removal of IRC Section 280E, enabling state-legal cannabis operators to deduct normal business expenses and sharply improve profitability, cash flows, and balance-sheet strength. In parallel, rescheduling could ease access to traditional banking services, lower financing costs, and broaden institutional participation by reducing federal legal risk. Canadian cannabis companies also rallied strongly, driven by expectations that U.S. regulatory easing would open pathways to the world’s largest cannabis market through partnerships, acquisitions, or direct entry. Overall, the move represents a major regulatory de-risking event that has prompted a rapid re-rating of the sector, underpinned by improved long-term earnings visibility rather than immediate demand changes.
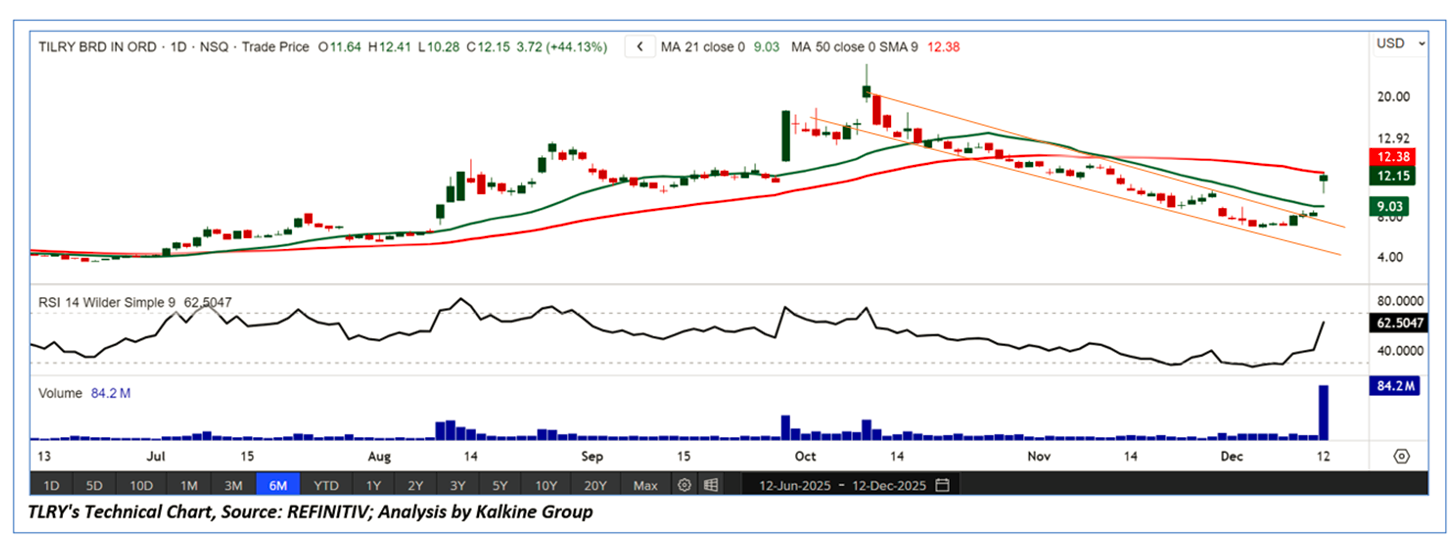
Technical Observation (on the daily chart)
TLRY’s stock price has broken out of its declining channel pattern and moved higher on strong volume, indicating the potential for a near-term upward move and a possible short-term rally. The 14-period RSI has surged above the midpoint and is trending upward, further supporting a bullish outlook. Additionally, the stock is trading above its 21-period simple moving average, which reinforces positive sentiment. Overall, these technical signals suggest a higher probability of continued gains as long as the price remains above key support levels. If the current momentum continues, further short-term advances seem likely.
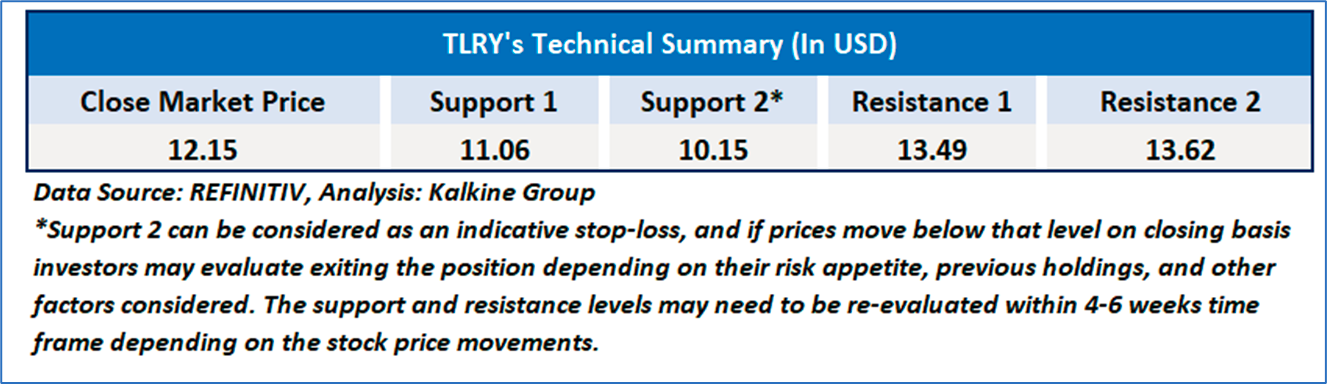

As per the above-mentioned price action, recent key business and financial updates, momentum in the stock over the last month, and technical indicators analysis, a ‘Speculative Buy’ rating has been given to Tilray Brands, Inc. (NASDAQ: TLRY) its close market price of USD 12.15 as of December 12, 2025.
Individuals can evaluate the stock based on the support and resistance levels provided in the report in case of keen interest taking into consideration the risk-reward scenario.
Markets are trading in a highly volatile zone currently due to certain macro-economic issues and prevailing geopolitical tensions. Therefore, it is prudent to follow a cautious approach while investing.
Related Risk: This report may be looked at from a high-risk perspective, and a recommendation is provided for a short duration. This report is solely based on technical parameters, and the fundamental performance of the stocks has not been considered in the decision-making process. Other factors which could impact the stock prices include market risks, regulatory risks, interest rates risks, currency risks, social and political instability risks etc.
How to Read the Charts?
The green colour line reflects the 21-period simple moving average (SMA) while the red line indicates the 50- period simple moving average (SMA). SMA helps to identify existing price trends. If the prices are trading above the 21-period and 50-period moving average, then it shows prices are currently trading in a bullish trend.
The black colour line in the chart’s lower segment reflects the Relative Strength Index (14-Period) which indicates price momentum and signals momentum in trend. A reading of 70 or above suggests overbought status while a reading of 30 or below suggests an oversold status.
The blue colour bars in the chart’s lower segment show the volume of the stock. The volume is the number of shares that changed hands during a given day. Stocks with high volumes are more liquid than stocks with lesser volume as liquidity in stocks helps with easier and faster execution of the order.
The Orange colour lines are the trend lines drawn by connecting two or more price points and used for trend identification purposes. The trend line also acts as a line of support and resistance.
Technical Indicators Defined: -
Support: A level at which the stock prices tend to find support if they are falling, and a downtrend may take a pause backed by demand or buying interest. Support 1 refers to the nearby support level for the stock and if the price breaches the level, then Support 2 may act as the crucial support level for the stock.
Resistance: A level at which the stock prices tend to find resistance when they are rising, and an uptrend may take a pause due to profit booking or selling interest. Resistance 1 refers to the nearby resistance level for the stock and if the price surpasses the level, then Resistance 2 may act as the crucial resistance level for the stock.
Stop-loss: It is a level to protect further losses in case of unfavourable movement in the stock prices.
Past performance is neither an indicator nor a guarantee of future performance.
The reference date for all price data, currency, technical indicators, support, and resistance levels is of December 12, 2025. The reference data in this report has been partly sourced from REFINITIV.
Abbreviations
CMP: Current Market Price
SMA: Simple Moving Average
RSI: Relative Strength Index
USD: United States dollar
Note: Trading decisions require a thorough analysis by individual. Technical reports in general chart out metrics that may be assessed by individuals before any stock evaluation. The above are illustrative analytical factors used for evaluating stocks; other parameters can be looked at along with additional risks per se. Past performance is neither an indicator nor a guarantee of future performance.

 Please wait processing your request...