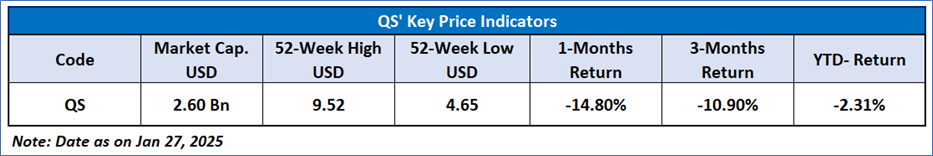
QuantumScape Corporation (NYSE: QS)
QuantumScape Corporation (NYSE: QS) is developing solid-state lithium-metal battery technology for electric vehicles (EVs) and other applications. The Company's solid-state lithium-metal battery technology is designed to offer greater energy density, faster charging and enhanced safety.
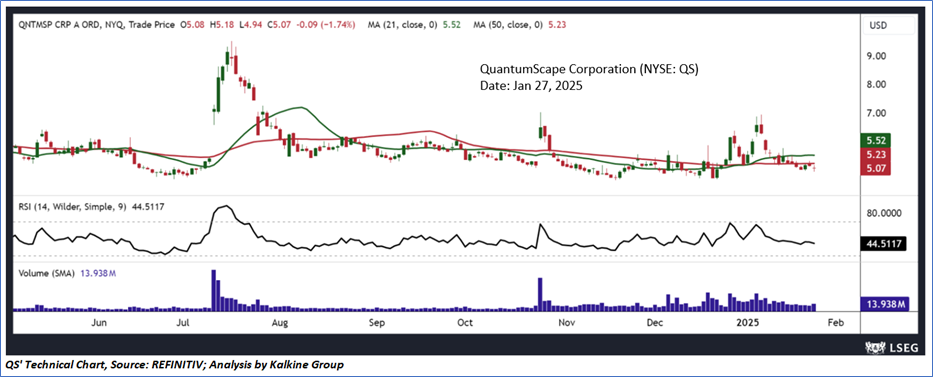
Technical Observation (on the daily chart):
QS' stock price is approaching its crucial support levels, hinting at a possible reversal and paving the way for a potential upward trajectory. Currently, the 14-day Relative Strength Index (RSI) is below its neutral midpoint, suggesting that a positive shift may be on the horizon. Additionally, the 50-day Simple Moving Average (SMA) is positioned above the current stock price, and it's anticipated that once the stock price reaches this level, the 50-day SMA will likely hold support, further boosting buying interest in the stock.
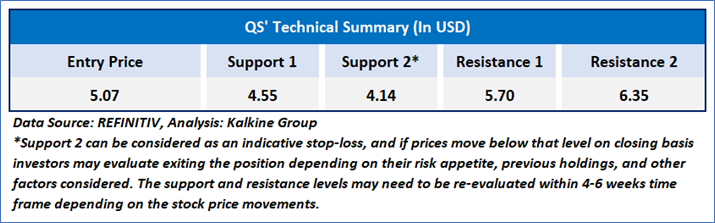
As per the above-mentioned price action, recent key business and financial updates, momentum in the stock over the last month, and technical indicators analysis, a ‘Speculative Buy’ rating has been given to QuantumScape Corporation (NYSE: QS) at its close price of USD 5.07 as of Jan 27, 2025.

Individuals can evaluate the stock based on the support and resistance levels provided in the report in case of keen interest taking into consideration the risk-reward scenario.
Markets are trading in a highly volatile zone currently due to certain macro-economic issues and prevailing geopolitical tensions. Therefore, it is prudent to follow a cautious approach while investing.
Related Risk: This report may be looked at from a high-risk perspective and a recommendation is provided for a short duration. This report is solely based on technical parameters, and the fundamental performance of the stocks has not been considered in the decision-making process. Other factors which could impact the stock prices include market risks, regulatory risks, interest rates risks, currency risks, social and political instability risks etc.
Technical Indicators Defined: -
Support: A level at which the stock prices tend to find support if they are falling, and a downtrend may take a pause backed by demand or buying interest. Support 1 refers to the nearby support level for the stock and if the price breaches the level, then Support 2 may act as the crucial support level for the stock.
Resistance: A level at which the stock prices tend to find resistance when they are rising, and an uptrend may take a pause due to profit booking or selling interest. Resistance 1 refers to the nearby resistance level for the stock and if the price surpasses the level, then Resistance 2 may act as the crucial resistance level for the stock.
Stop-loss: It is a level to protect further losses in case of unfavourable movement in the stock prices.
Past performance is neither an indicator nor a guarantee of future performance.
The reference date for all price data, currency, technical indicators, support, and resistance levels is of Jan 27, 2025. The reference data in this report has been partly sourced from REFINITIV.
Abbreviations
CMP: Current Market Price
SMA: Simple Moving Average
RSI: Relative Strength Index
USD: United States dollar
Note: Trading decisions require a thorough analysis by individual. Technical reports in general chart out metrics that may be assessed by individuals before any stock evaluation. The above are illustrative analytical factors used for evaluating stocks; other parameters can be looked at along with additional risks per se. Past performance is neither an indicator nor a guarantee of future performance.

 Please wait processing your request...