Company Overview:
Avalon Advanced Materials Inc. (TSX: AVL) is a Canadian critical minerals company advancing the supply of materials essential for Canadas future. The Company is focused on developing strategic assets that support secure, domestic supply chains and long-term economic growth. Avalon is focused on vertically integrating the Ontario lithium supply chain through the development of Lake Superior Lithium Inc., Ontarios first midstream lithium hydroxide processing facility, located in Thunder Bay. This facility will serve as a vital link between northern Ontarios lithium resources and the growing EV battery manufacturing base in southern Ontario and North America. Through a joint venture with SCR-Sibelco NV, Avalon is advancing the Separation Rapids Lithium Project near Kenora, Ontario, as well as continuing exploration at its Snowbank lithium and Lilypad lithium-cesium deposits. The Company is also advancing the Nechalacho Rare Earths and Zirconium Project in the Northwest Territories. This deposit contains all light and heavy rare earth elements, as well as yttrium, zirconium, tantalum, and niobium-critical minerals used in advanced technologies across the communications, defense, clean tech, and energy sectors.
This Report covers the Price Action, Technical Indicators Analysis along with the Support Levels, Resistance Levels, and Recommendations on this stock.
Fundamental Highlights:
- Strategic Asset Valuation and Infrastructure Advantage: The company's Thunder Bay industrial property, valued at CAD 57-62 million, provides a significant asset base with existing infrastructure. This substantially reduces the initial capital required for the Lake Superior Lithium Project.
- Promising Project Economics from Preliminary Assessment: A PEA for the Thunder Bay facility indicates strong potential, with a CAD 4.1B after-tax NPV and 48% IRR. The projected after-tax payback period is just 2.5 years based on long-term price assumptions.
- Diversified Strategy for Feedstock and Revenue: Avalon's strategy diversifies lithium feedstock via third-party agreements and its joint venture, reducing supply risk. It is also exploring additional revenue from a potential solar farm and commercializing its analcime sand byproduct.
- Alignment with Governmental Critical Minerals Initiatives: The company's projects align with government priorities for domestic battery supply chains, evidenced by a CAD 500,000 Ontario grant for byproduct research. This confirms its role in supporting regional and national industrial policy goals.
AVL’s Technical Observation:
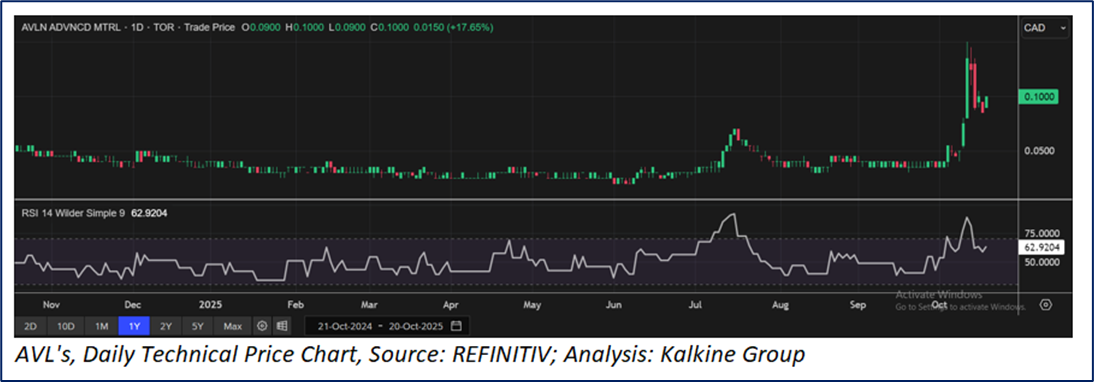
AVL is trading at CAD 0.1, up by 14.70% from the previous close. The stock has seen a sharp rally over the past few weeks, surging from below CAD 0.03 in mid-2025 to a recent high above CAD 0.15, indicating decent upward momentum. The price currently remains above its short-term support level around CAD 0.03, suggesting that the bullish trend is still intact despite the recent pullback. Overall, AVL continues to show bullish sentiment in the medium term, supported by recent gains and price action above key short-term levels.

AVL’s Daily Price Chart
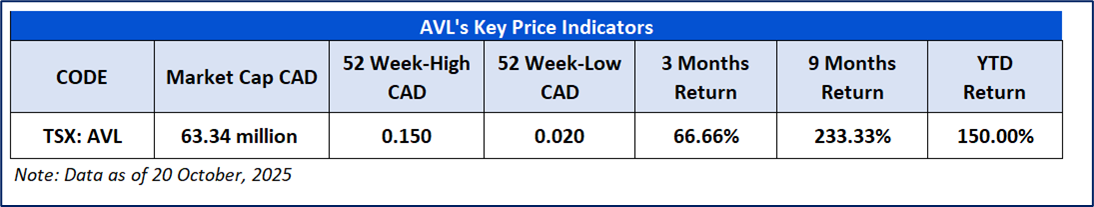
As per the above-mentioned price action and technical indicators analysis, a ‘Speculative Buy’ rating has been given Avalon Advanced Materials Inc. (TSX: AVL) at the Last Closing Price of CAD 0.1, as on 20 October 2025.
Individuals can evaluate the stock based on the support and resistance levels provided in the report in case of keen interest taking into consideration the risk-reward scenario.
Markets are trading in a highly volatile zone currently due to certain Macro & Micro-economic data and prevailing geopolitical tensions. Therefore, it is prudent to follow a cautious approach while investing.
Note 1: Past performance is not a reliable indicator of future performance.
Note 2: Investment decisions should be made depending on an individual’s appetite for upside potential, risks, and any previous holdings. This recommendation is purely based on technical analysis, and fundamental analysis has not been considered in this report. Individuals can consider exiting from the stock if the Target Price or Stop loss mentioned as per the technical analysis has been achieved and is subject to the factors discussed above.
Note 3: Related Risks: This report may be looked at from a high-risk perspective, and recommendations are provided for a short duration. Recommendations provided in this report are solely based on technical parameters, and the fundamental performance of the stocks has not been considered in the decision-making process. Other factors which could impact the stock prices include market risks, regulatory risks, interest rate risks, currency risks, social and political instability risks etc.
Note 4: How to Read the Charts?
The Yellow color line reflects the 20-period moving average. SMA helps to identify existing price trends. If the prices are trading above the 20-period moving average, then it shows prices are currently trading in a bullish trend.
The Purple color line in the chart’s lower segment reflects the Relative Strength Index (14-Period) which indicates price momentum and signals momentum in trend. A reading of 70 or above suggests overbought status while a reading of 30 or below suggests an oversold status.
The Ink Blue color lines are the trend lines drawn by connecting two or more price points and used for trend identification purposes. The trend line also acts as a line of support and resistance.
Technical Indicators Defined: -
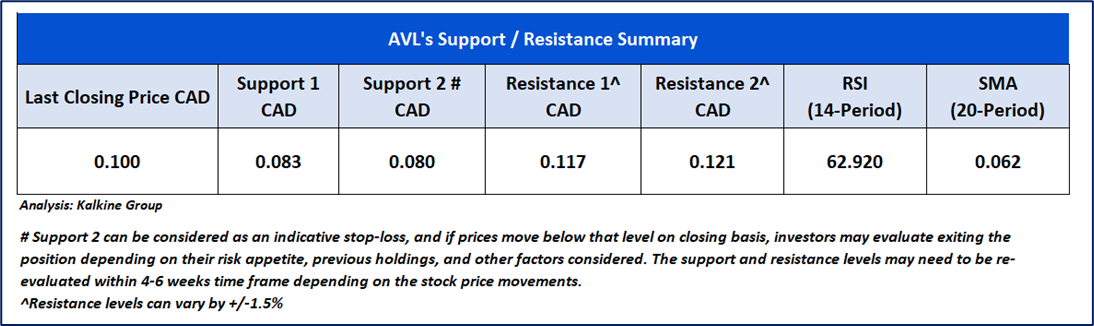
Support: A level at which stock prices tend to find support if they fall, and a downtrend may take a pause backed by demand or buying interest. Support 1 refers to the nearby support level for the stock and if the price breaches the level, then Support 2 may act as the crucial support level for the stock.
Resistance: A level at which stock prices tend to find resistance when they are rising, and an uptrend may take a pause due to profit booking or selling interest. Resistance 1 refers to the nearby resistance level for the stock and if the price surpasses the level, then Resistance 2 may act as the crucial resistance level for the stock.
Stop-loss: It is a level to protect against further losses in case of unfavorable movement in the stock prices.
The reference date for all price data, currency, technical indicators, support, and resistance levels is 20 October 2025. The reference data in this report has been partly sourced from REFINITIV.
Abbreviations
CMP: Current Market Price
SMA: Simple Moving Averages
CAD: Canadian Dollar
RSI: Relative Strength Index
USD: United States dollar
Note: Trading decisions require a thorough analysis by individuals. Technical reports in general chart out metrics that may be assessed by individuals before any stock evaluation. The above are illustrative analytical factors used for evaluating stocks; other parameters can be looked at along with additional risks per se. Past performance is neither an indicator nor a guarantee of future performance.

 Please wait processing your request...