Company Overview:
Volatus Aerospace Inc. (TSXV: FLT) is a leader in innovative global aerial solutions for intelligence and cargo. With over 100 years of combined institutional knowledge in aviation, Volatus provides comprehensive solutions using both piloted and remotely piloted aircraft systems for a wide array of industries, including oil and gas, energy utilities, healthcare, public safety, and infrastructure. The Company is committed to enhancing operational efficiency, safety, and sustainability through cutting-edge aerial technologies.
This Report covers the Price Action, Technical Indicators Analysis along with the Support Levels, Resistance Levels, and Recommendations on this stock.
Fundamental Highlights:
Volatus Aerospace has successfully delivered tactical ISR drone systems worth CAD 1.85 million to a NATO partner, marking a key milestone in its defense role. These advanced drones enhance situational awareness with all-weather, day/night capabilities. The delivery highlights Volatus’ growing impact in global defense, meeting allied demands for agile, high-performance aerial intelligence solutions in evolving operational landscapes.
FLT’s Technical Observation:
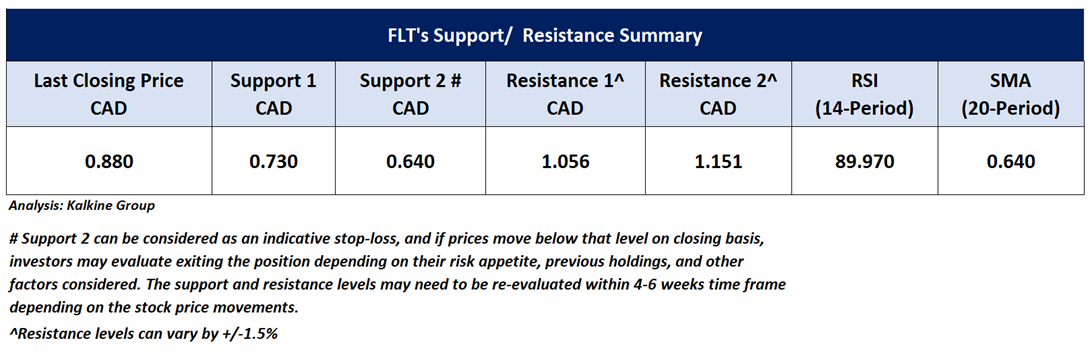
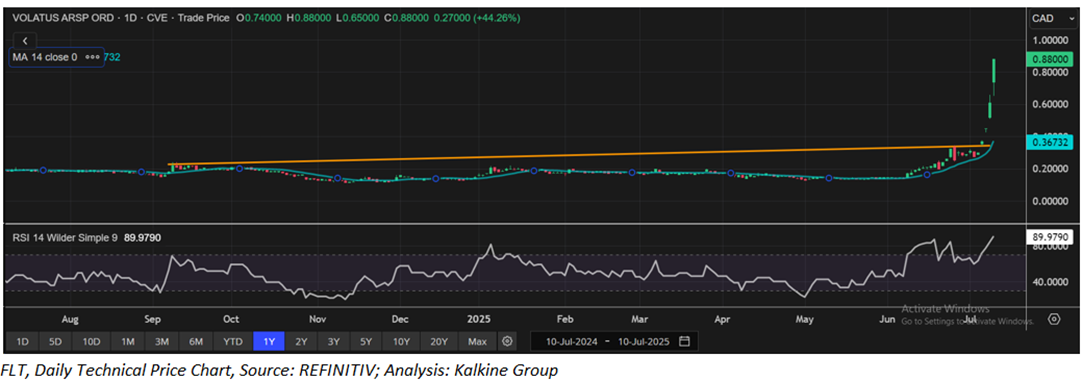
On the daily chart, the stock is currently trading at CAD 0.88, having experienced a strong rally from recent lows. The price surged following a breakout from its rising trendline, and it is holding above the 20-day moving average at CAD 0.64, which suggests ongoing bullish momentum. The recent breakout above CAD 0.4 and the moving average signals potential strength, with the next resistance around CAD 1.056 & CAD 1.151. If the stock holds above the CAD 0.74 support zone, further upward movement could be expected in the near term.

FLT’s Daily Price Chart
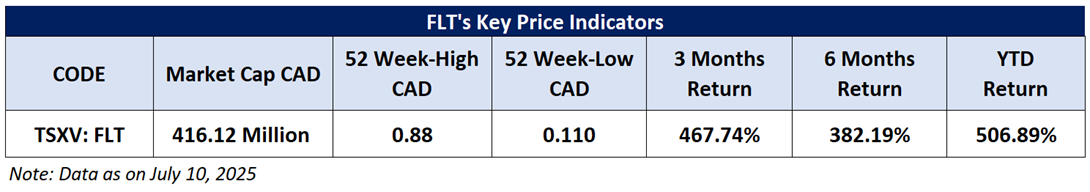
As per the above-mentioned price action and technical indicators analysis, a ‘Speculative Buy’ rating has been given Volatus Aerospace Inc. (TSXV: FLT) at the closing market price of CAD 0.88, as of 10 July 2025. Individuals can evaluate the stock based on the support and resistance levels provided in the report in case of keen interest taking into consideration the risk-reward scenario.
Markets are trading in a highly volatile zone currently due to certain Macro & Micro-economic data and prevailing geopolitical tensions. Therefore, it is prudent to follow a cautious approach while investing.
Note 1: Past performance is not a reliable indicator of future performance.
Note 2: Investment decisions should be made depending on an individual’s appetite for upside potential, risks, and any previous holdings. This recommendation is purely based on technical analysis, and fundamental analysis has not been considered in this report. Individuals can consider exiting from the stock if the Target Price or Stop loss mentioned as per the technical analysis has been achieved and is subject to the factors discussed above.
Note 3: Related Risks: This report may be looked at from a high-risk perspective and recommendations are provided for a short duration. Recommendations provided in this report are solely based on technical parameters, and the fundamental performance of the stocks has not been considered in the decision-making process. Other factors which could impact the stock prices include market risks, regulatory risks, interest rate risks, currency risks, social and political instability risks etc.
Note 4: How to Read the Charts?
The Yellow color line reflects the 20-period moving average. SMA helps to identify existing price trends. If the prices are trading above the 20-period moving average, then it shows prices are currently trading in a bullish trend.
The Purple color line in the chart’s lower segment reflects the Relative Strength Index (14-Period) which indicates price momentum and signals momentum in trend. A reading of 70 or above suggests overbought status while a reading of 30 or below suggests an oversold status.
The Ink Blue color lines are the trend lines drawn by connecting two or more price points and used for trend identification purposes. The trend line also acts as a line of support and resistance.
Technical Indicators Defined: -
Support: A level at which the stock prices tend to find support if they are falling, and a downtrend may take a pause backed by demand or buying interest. Support 1 refers to the nearby support level for the stock and if the price breaches the level, then Support 2 may act as the crucial support level for the stock.
Resistance: A level at which stock prices tend to find resistance when they are rising, and an uptrend may take a pause due to profit booking or selling interest. Resistance 1 refers to the nearby resistance level for the stock and if the price surpasses the level, then Resistance 2 may act as the crucial resistance level for the stock.
Stop-loss: It is a level to protect against further losses in case of unfavorable movement in the stock prices.
The reference date for all price data, currency, technical indicators, support, and resistance levels is 10 July 2025. The reference data in this report has been partly sourced from REFINITIV.
Abbreviations
CMP: Current Market Price
SMA: Simple Moving Averages
CAD: Canadian Dollar
RSI: Relative Strength Index
USD: United States dollar
Note: Trading decisions require a thorough analysis by individuals. Technical reports in general chart out metrics that may be assessed by individuals before any stock evaluation. The above are illustrative analytical factors used for evaluating stocks; other parameters can be looked at along with additional risks per se. Past performance is neither an indicator nor a guarantee of future performance.

 Please wait processing your request...