Company Overview:
Gran Tierra Energy Inc. (TSX: GTE) is an independent energy company. It is engaged in the acquisition, exploration, development, and production of oil and gas properties in proven, under-explored hydrocarbon basins that have access to established infrastructure. The firm produces primarily light crude oil, supplemented with medium crude and natural gas. Gran Tierra holds interests in producing and prospective properties in Colombia and prospective properties in Ecuador. The company has a strategy that focuses on establishing a portfolio of producing properties, plus production enhancement and exploration opportunities to provide a base for future growth.
This Report covers the Price Action, Technical Indicators Analysis along with the Support Levels, Resistance Levels, and Recommendations on this stock.
Fundamental Highlights:
- Exploration Success and Portfolio Expansion in Ecuador: Gran Tierra has confirmed its Ecuadorian acreage's potential with three consecutive discoveries. Having met all exploration commitments, the company now transitions to the development phase, establishing a foundation for predictable, long-term production growth from this new core area.
- Operational Performance and Recovery from Temporary Setbacks: Despite a Q3 impact from temporary events, the assets are performing well. Production has recovered to roughly 45,200 boepd, with the Cohembi field reaching a decade-high, demonstrating the success of recent development work and waterflood programs.
- Enhanced Financial Flexibility and Strengthened Balance Sheet: GTE has enhanced its capital structure with a new USD 200 million prepayment facility and an expanded CAD 75 million credit facility. This improved liquidity provides financial flexibility to fund initiatives and reduce debt, positioning the company for a more sustainable financial future.
- Diversified Asset Base Driving Production Growth: Gran Tierra's Canadian acquisition has diversified its production base. Four Lower Montney wells brought online in 2025 are meeting or exceeding targets, contributing to output. This geographic diversification mitigates single-country risk and establishes additional sources for production growth.
GTE’s Technical Observation:
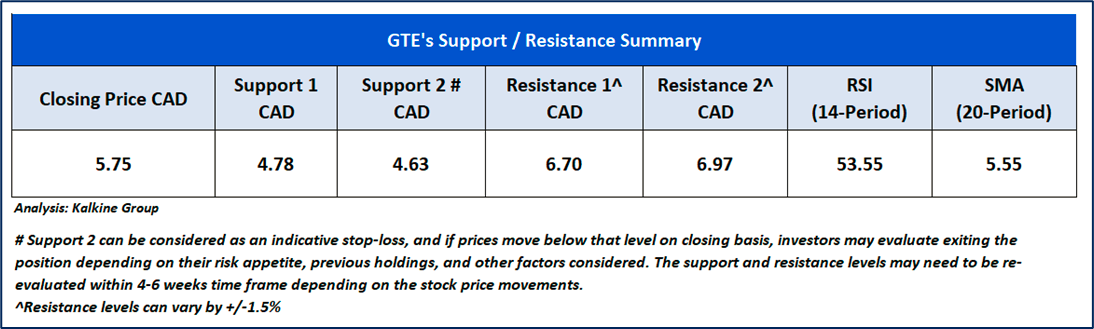
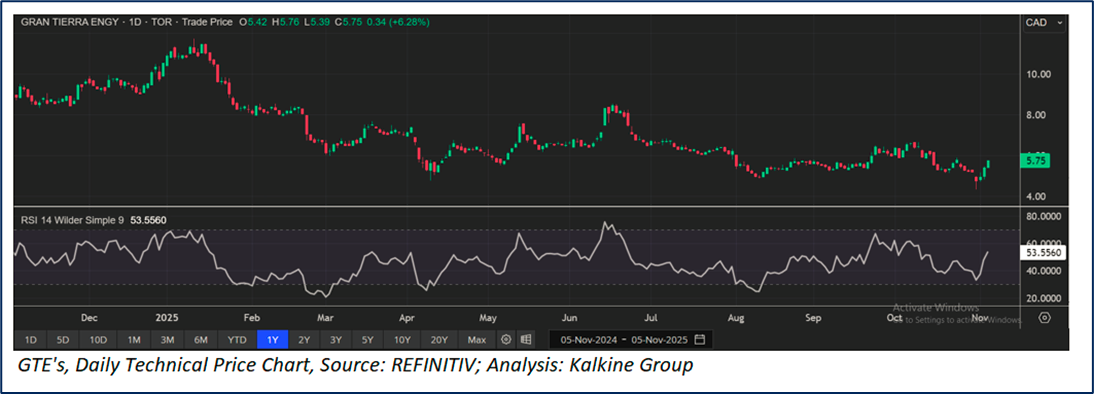
GTE is trading at CAD 5.75, up by 6.28% from previous close. The stock has seen a sharp rally over the past few weeks, surging from below CAD 4.95 in mid-2025 to a recent high above CAD 6.65, indicating decent upward momentum. The price currently remains above its short-term support level around CAD 4.78, suggesting that the bullish trend is still intact despite the recent pullback. Overall, GTE continues to show bullish sentiment in the medium term, supported by recent gains and price action above key short-term levels.

GTE’s Daily Price Chart
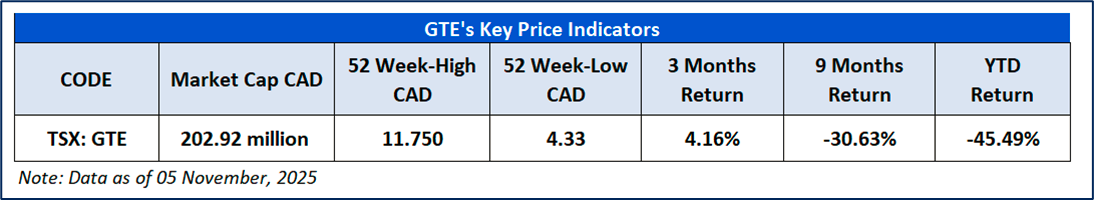
As per the above-mentioned price action and technical indicators analysis, a ‘Speculative Buy’ rating has been given Gran Tierra Energy Inc. (TSX: GTE) at the Last Closing Price of CAD 5.75, as on 05 November 2025.
Individuals can evaluate the stock based on the support and resistance levels provided in the report in case of keen interest taking into consideration the risk-reward scenario.
Markets are trading in a highly volatile zone currently due to certain Macro & Micro-economic data and prevailing geopolitical tensions. Therefore, it is prudent to follow a cautious approach while investing.
Note 1: Past performance is not a reliable indicator of future performance.
Note 2: Investment decisions should be made depending on an individual’s appetite for upside potential, risks, and any previous holdings. This recommendation is purely based on technical analysis, and fundamental analysis has not been considered in this report. Individuals can consider exiting from the stock if the Target Price or Stop loss mentioned as per the technical analysis has been achieved and is subject to the factors discussed above.
Note 3: Related Risks: This report may be looked at from a high-risk perspective, and recommendations are provided for a short duration. Recommendations provided in this report are solely based on technical parameters, and the fundamental performance of the stocks has not been considered in the decision-making process. Other factors which could impact the stock prices include market risks, regulatory risks, interest rate risks, currency risks, social and political instability risks etc.
Note 4: How to Read the Charts?
The Yellow color line reflects the 20-period moving average. SMA helps to identify existing price trends. If the prices are trading above the 20-period moving average, then it shows prices are currently trading in a bullish trend.
The Purple color line in the chart’s lower segment reflects the Relative Strength Index (14-Period) which indicates price momentum and signals momentum in trend. A reading of 70 or above suggests overbought status while a reading of 30 or below suggests an oversold status.
The Ink Blue color lines are the trend lines drawn by connecting two or more price points and used for trend identification purposes. The trend line also acts as a line of support and resistance.
Technical Indicators Defined: -
Support: A level at which stock prices tend to find support if they fall, and a downtrend may take a pause backed by demand or buying interest. Support 1 refers to the nearby support level for the stock and if the price breaches the level, then Support 2 may act as the crucial support level for the stock.
Resistance: A level at which stock prices tend to find resistance when they are rising, and an uptrend may take a pause due to profit booking or selling interest. Resistance 1 refers to the nearby resistance level for the stock and if the price surpasses the level, then Resistance 2 may act as the crucial resistance level for the stock.
Stop-loss: It is a level to protect against further losses in case of unfavorable movement in the stock prices.
The reference date for all price data, currency, technical indicators, support, and resistance levels is 05 November 2025. The reference data in this report has been partly sourced from REFINITIV.
Abbreviations
CMP: Current Market Price
SMA: Simple Moving Averages
CAD: Canadian Dollar
RSI: Relative Strength Index
USD: United States dollar
Note: Trading decisions require a thorough analysis by individuals. Technical reports in general chart out metrics that may be assessed by individuals before any stock evaluation. The above are illustrative analytical factors used for evaluating stocks; other parameters can be looked at along with additional risks per se. Past performance is neither an indicator nor a guarantee of future performance.

 Please wait processing your request...