Company Overview:
Kirkstone Metals Corp. (TSXV: KSM) is engaged in the business of the acquisition and exploration of mineral properties in Canada. The Company holds a 100% interest in and to mineral claims totaling 6,949.80 hectares comprising the Gorilla Lake Property, located in North Saskatchewan, Canada, subject to a royalty obligation. The Company's secondary objective is to locate and develop economic precious and base metals properties of merit.
This Report covers the Price Action, Technical Indicators Analysis along with the Support Levels, Resistance Levels, and Recommendations on this stock.
Fundamental Highlights:
- Strategic Uranium Acquisition: Kirkstone entered an LOI to acquire 100% of the Key Lake Road Uranium Project, a highly prospective asset in the Athabasca Basin, one of the world’s most productive uranium districts.
- Decent Historical Results: Past drilling highlights include 642 ppm uranium in the DD Zone and 1.9% U₃O₈ over 0.29m in the Highway Zone, providing a healthy foundation for high-grade discoveries.
- Prime Location and Infrastructure: The property lies ~90 km from Cameco’s Key Lake Mine, with excellent highway access and proximity to major uranium deposits, supporting cost-efficient exploration.
KSM’s Technical Observation:
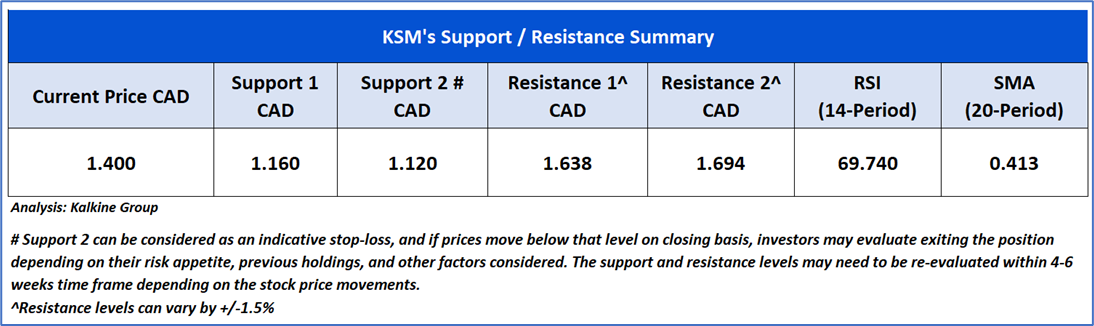
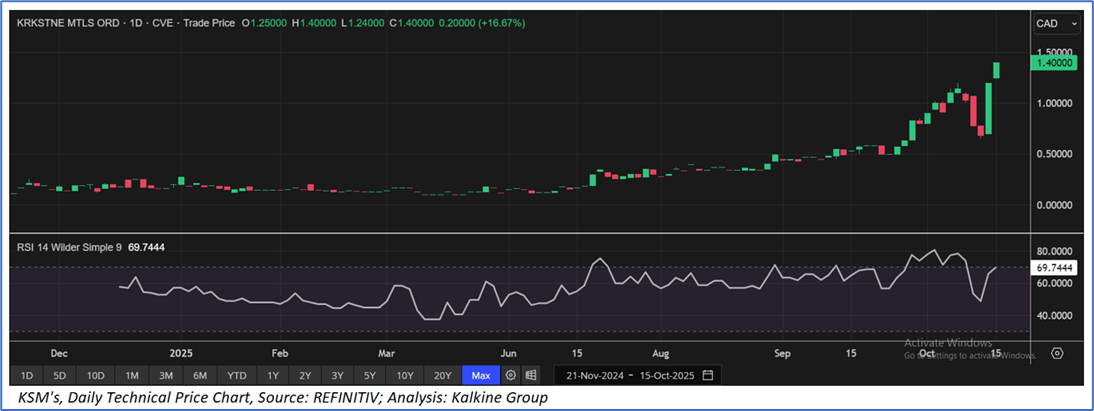
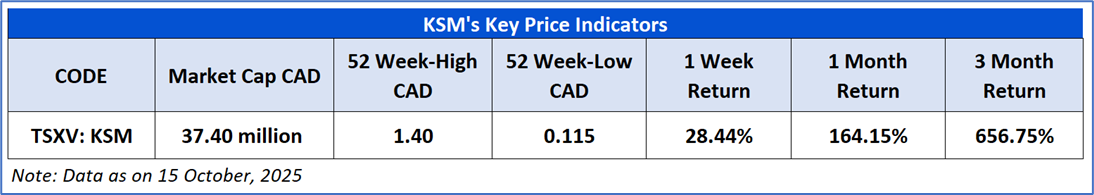
Kirkstone Metals Corp. (TSXV: KSM) is trading at CAD 1.40, up 16.67% from the previous close. The stock has witnessed a powerful rally since July 2025, accelerating from below CAD 0.30 to a new high of CAD 1.50 and exhibiting sustained upside momentum. Currently, the price is holding well above a key short-term support near CAD 1.10, reinforcing the bullish structure despite some recent volatility. The latest RSI reading of 69.74 indicates that the stock is near overbought territory but not excessively stretched, suggesting that bullish sentiment remains high for the medium term, with continued momentum and price action above critical support levels.

KSM’s Daily Price Chart
As per the above-mentioned price action and technical indicators analysis, a ‘Speculative Buy’ rating has been given Kirkstone Metals Corp. (TSXV: KSM) at the closing market price of CAD 1.40, as of 15 October, 2025.
Individuals can evaluate the stock based on the support and resistance levels provided in the report in case of keen interest taking into consideration the risk-reward scenario.
Markets are trading in a highly volatile zone currently due to certain Macro & Micro-economic data and prevailing geopolitical tensions. Therefore, it is prudent to follow a cautious approach while investing.
Note 1: Past performance is not a reliable indicator of future performance.
Note 2: Investment decisions should be made depending on an individual’s appetite for upside potential, risks, and any previous holdings. This recommendation is purely based on technical analysis, and fundamental analysis has not been considered in this report. Individuals can consider exiting from the stock if the Target Price or Stop loss mentioned as per the technical analysis has been achieved and is subject to the factors discussed above.
Note 3: Related Risks: This report may be looked at from a high-risk perspective and recommendations are provided for a short duration. Recommendations provided in this report are solely based on technical parameters, and the fundamental performance of the stocks has not been considered in the decision-making process. Other factors which could impact the stock prices include market risks, regulatory risks, interest rate risks, currency risks, social and political instability risks etc.
Note 4: How to Read the Charts?
The Yellow color line reflects the 20-period moving average. SMA helps to identify existing price trends. If the prices are trading above the 20-period moving average, then it shows prices are currently trading in a bullish trend.
The Purple color line in the chart’s lower segment reflects the Relative Strength Index (14-Period) which indicates price momentum and signals momentum in trend. A reading of 70 or above suggests overbought status while a reading of 30 or below suggests an oversold status.
The Ink Blue color lines are the trend lines drawn by connecting two or more price points and used for trend identification purposes. The trend line also acts as a line of support and resistance.
Technical Indicators Defined: -
Support: A level at which the stock prices tend to find support if they are falling, and a downtrend may take a pause backed by demand or buying interest. Support 1 refers to the nearby support level for the stock and if the price breaches the level, then Support 2 may act as the crucial support level for the stock.
Resistance: A level at which stock prices tend to find resistance when they are rising, and an uptrend may take a pause due to profit booking or selling interest. Resistance 1 refers to the nearby resistance level for the stock and if the price surpasses the level, then Resistance 2 may act as the crucial resistance level for the stock.
Stop-loss: It is a level to protect against further losses in case of unfavorable movement in the stock prices.
The reference date for all price data, currency, technical indicators, support, and resistance levels is 15 October, 2025. The reference data in this report has been partly sourced from REFINITIV.
Abbreviations
CMP: Current Market Price
SMA: Simple Moving Averages
CAD: Canadian Dollar
RSI: Relative Strength Index
USD: United States dollar
Note: Trading decisions require a thorough analysis by individuals. Technical reports in general chart out metrics that may be assessed by individuals before any stock evaluation. The above are illustrative analytical factors used for evaluating stocks; other parameters can be looked at along with additional risks per se. Past performance is neither an indicator nor a guarantee of future performance.

 Please wait processing your request...