Company Overview:
Serabi Gold PLC (TSX: SBI) is a gold exploration and production company. It is involved in the evaluation and development of gold deposits in Brazil. The company has two geographical segments namely Brazil and the UK. It generates maximum revenue from the Brazil region. The company projects include Palito, Sao Chico Gold Mines, Coringa, Jardim do Ouro and Tapajos Regional Exploration. It derives its majority revenue from the sale of gold.
This Report covers the Price Action, Technical Indicators Analysis along with the Support Levels, Resistance Levels, and Recommendations on this stock.
Fundamental Highlights:
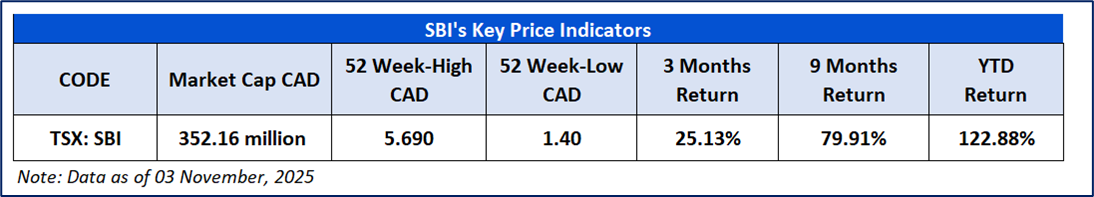
- Record-Breaking Operational Performance: Serabi Gold achieved record quarterly production of 12,090 ounces, a 27% year-over-year increase. With year-to-date output at 32,635 ounces, the company is on track to meet its full-year 2025 guidance of 44,000 - 47,000 ounces.
- Notable Financial Strength and Liquidity: The company exhibits a robust and strengthening financial position. Cash balances grew by USD 8.4 million in the quarter to USD 38.8 million, while net cash increased to USD 33.0 million. This substantial liquidity, bolstered by strong operational cash flow, provides a solid foundation for funding future growth initiatives and weathering market volatility without the need for dilutive financing.
- Sustained Grade Improvement Driving Profitability: Record production was driven by a higher average gold grade of 6.86 g/t Au, up from 5.62 g/t Au. This enhancement at both Palito and Coringa directly increases output, lowers unit costs, and boosts profitability.
- Successful Operational Strategy at Coringa: The ore sorter at Coringa has proven transformative, allowing low-grade stockpiles to be processed on-site while higher-grade ore is shipped to Palito. This strategy has unlocked incremental value and enabled the company to exceed its production targets for the asset.
SBI’s Technical Observation:
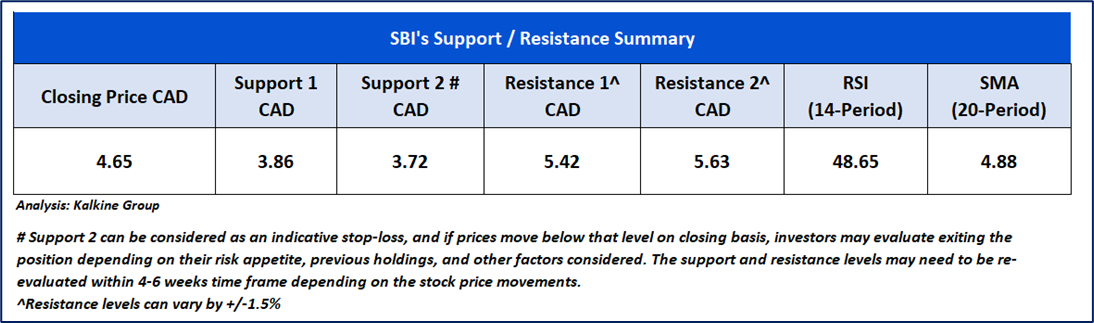
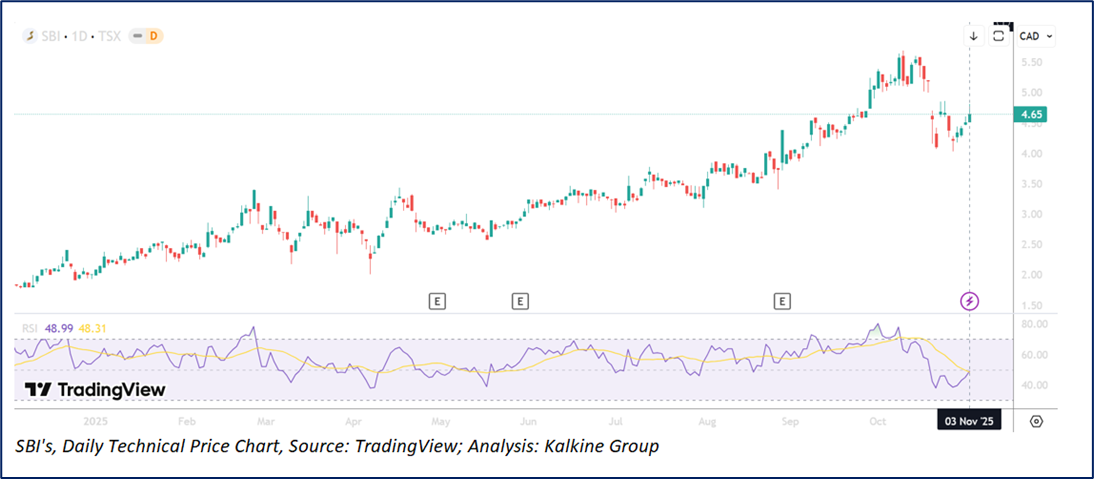
SBI is trading at CAD 4.65, up by 3.79% from previous close. The stock has seen a sharp rally over the past few weeks, surging from below CAD 3.11 in mid-2025 to a recent high above CAD 5.63, indicating decent upward momentum. The price currently remains above its short-term support level around CAD 3.86, suggesting that the bullish trend is still intact despite the recent pullback. Overall, SBI continues to show bullish sentiment in the medium term, supported by recent gains and price action above key short-term levels.

SBI’s Daily Price Chart
As per the above-mentioned price action and technical indicators analysis, a ‘Speculative Buy’ rating has been given Serabi Gold PLC (TSX: SBI) at the Last Closing Price of CAD 4.65, as on 03 November 2025.
Individuals can evaluate the stock based on the support and resistance levels provided in the report in case of keen interest taking into consideration the risk-reward scenario.
Markets are trading in a highly volatile zone currently due to certain Macro & Micro-economic data and prevailing geopolitical tensions. Therefore, it is prudent to follow a cautious approach while investing.
Note 1: Past performance is not a reliable indicator of future performance.
Note 2: Investment decisions should be made depending on an individual’s appetite for upside potential, risks, and any previous holdings. This recommendation is purely based on technical analysis, and fundamental analysis has not been considered in this report. Individuals can consider exiting from the stock if the Target Price or Stop loss mentioned as per the technical analysis has been achieved and is subject to the factors discussed above.
Note 3: Related Risks: This report may be looked at from a high-risk perspective, and recommendations are provided for a short duration. Recommendations provided in this report are solely based on technical parameters, and the fundamental performance of the stocks has not been considered in the decision-making process. Other factors which could impact the stock prices include market risks, regulatory risks, interest rate risks, currency risks, social and political instability risks etc.
Note 4: How to Read the Charts?
The Yellow color line reflects the 20-period moving average. SMA helps to identify existing price trends. If the prices are trading above the 20-period moving average, then it shows prices are currently trading in a bullish trend.
The Purple color line in the chart’s lower segment reflects the Relative Strength Index (14-Period) which indicates price momentum and signals momentum in trend. A reading of 70 or above suggests overbought status while a reading of 30 or below suggests an oversold status.
The Ink Blue color lines are the trend lines drawn by connecting two or more price points and used for trend identification purposes. The trend line also acts as a line of support and resistance.
Technical Indicators Defined: -
Support: A level at which stock prices tend to find support if they fall, and a downtrend may take a pause backed by demand or buying interest. Support 1 refers to the nearby support level for the stock and if the price breaches the level, then Support 2 may act as the crucial support level for the stock.
Resistance: A level at which stock prices tend to find resistance when they are rising, and an uptrend may take a pause due to profit booking or selling interest. Resistance 1 refers to the nearby resistance level for the stock and if the price surpasses the level, then Resistance 2 may act as the crucial resistance level for the stock.
Stop-loss: It is a level to protect against further losses in case of unfavorable movement in the stock prices.
The reference date for all price data, currency, technical indicators, support, and resistance levels is 03 November 2025. The reference data in this report has been partly sourced from REFINITIV.
Abbreviations
CMP: Current Market Price
SMA: Simple Moving Averages
CAD: Canadian Dollar
RSI: Relative Strength Index
USD: United States dollar
Note: Trading decisions require a thorough analysis by individuals. Technical reports in general chart out metrics that may be assessed by individuals before any stock evaluation. The above are illustrative analytical factors used for evaluating stocks; other parameters can be looked at along with additional risks per se. Past performance is neither an indicator nor a guarantee of future performance.

 Please wait processing your request...