Company Overview:
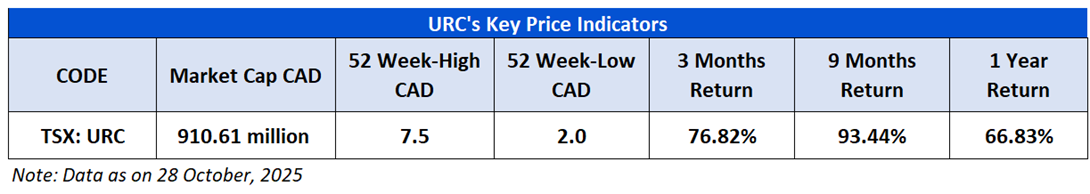
Uranium Royalty Corp. (TSX: URC) is focused on gaining exposure to uranium prices by making investments in uranium interests, including royalties, streams, debt and equity investments in uranium companies, and through holdings of physical uranium. The company operates in a single segment, the investment in a portfolio of uranium interests.
This Report covers the Price Action, Technical Indicators Analysis along with the Support Levels, Resistance Levels, and Recommendations on this stock.
Fundamental Highlights:
- Expanding North American Royalty Portfolio: Uranium Royalty Corp. continues to grow its high-quality portfolio through strategic acquisitions in key uranium jurisdictions. The company’s latest addition, a 2.0% gross overriding royalty on Forum Energy Metals’ Aberdeen Uranium Project in Nunavut, broadens exposure to Canada’s emerging Thelon Basin, a promising analogue to Saskatchewan’s Athabasca Basin. This strengthens URC’s position as the leading pure-play uranium royalty company with diversified project exposure.
- Aberdeen Project: Strategic Location and High-Grade Potential: The Aberdeen Project lies adjacent to Orano’s Kiggavik deposit, one of the largest undeveloped uranium resources globally with over 132 million pounds of U₃O₈. Early drill results at Aberdeen have returned decent intercepts, including 1.15% U₃O₈ over 2.4 metres, confirming high-grade potential. With 95,000+ hectares of underexplored ground and proximity to existing infrastructure, the project represents a valuable optionality play on future uranium development in Nunavut.
- Accretive Transactions Funded from Cash: Both acquisitions were funded entirely from URC’s decent cash position CAD 1 mn for the Aberdeen royalty and USD 6 mn for the Millennium and Cree Extension royalty. This disciplined approach highlights management’s capital efficiency and ability to secure accretive deals without dilution. Each royalty enhances future optionality while preserving balance sheet strength.
URC’s Technical Observation:
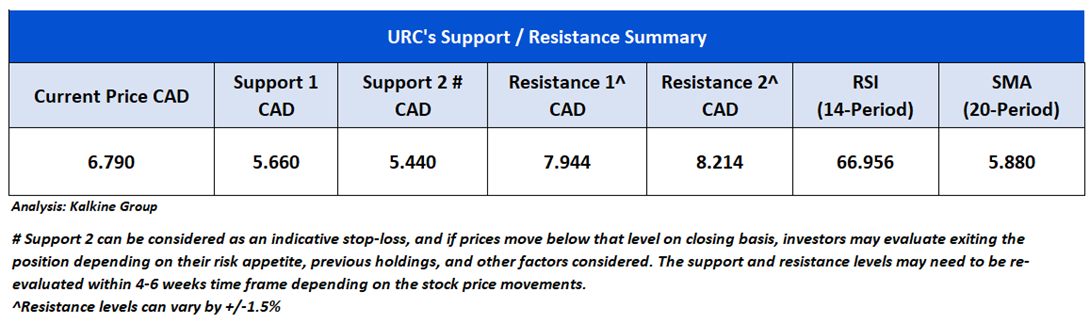
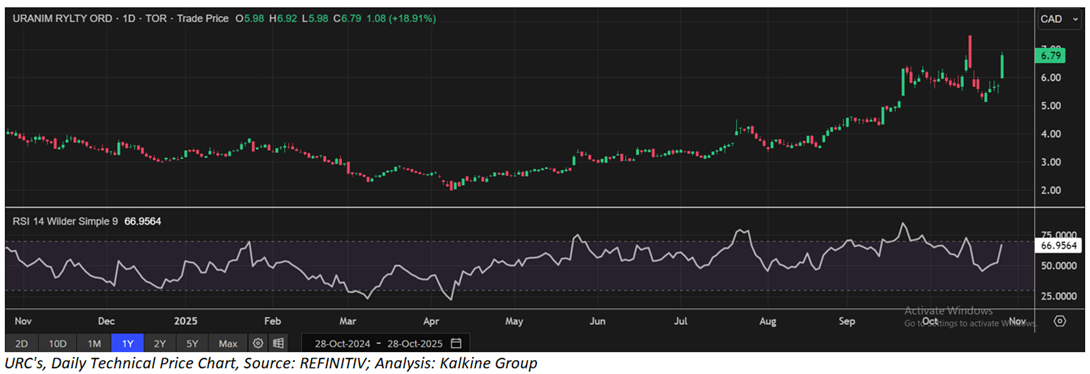
URC is trading at CAD 6.79, up 18.91% from the previous close. The stock has shown renewed momentum after a brief consolidation phase, extending its sharp rally from early 2025 when it traded below CAD 3. The price remains firmly above short-term support near CAD 6, indicating continued bullish strength. The RSI at 66.956 reflects healthy buying pressure, nearing overbought territory but still supportive of upward momentum. Overall, URC maintains a positive technical outlook, driven by decent trend continuation and rising investor confidence in the uranium sector.

URC’s Daily Price Chart
As per the above-mentioned price action and technical indicators analysis, a ‘Speculative Buy’ rating has been given Uranium Royalty Corp. (TSX: URC) at the closing market price of CAD 6.79, as of 28 October, 2025.
Individuals can evaluate the stock based on the support and resistance levels provided in the report in case of keen interest taking into consideration the risk-reward scenario.
Markets are trading in a highly volatile zone currently due to certain Macro & Micro-economic data and prevailing geopolitical tensions. Therefore, it is prudent to follow a cautious approach while investing.
Note 1: Past performance is not a reliable indicator of future performance.
Note 2: Investment decisions should be made depending on an individual’s appetite for upside potential, risks, and any previous holdings. This recommendation is purely based on technical analysis, and fundamental analysis has not been considered in this report. Individuals can consider exiting from the stock if the Target Price or Stop loss mentioned as per the technical analysis has been achieved and is subject to the factors discussed above.
Note 3: Related Risks: This report may be looked at from a high-risk perspective and recommendations are provided for a short duration. Recommendations provided in this report are solely based on technical parameters, and the fundamental performance of the stocks has not been considered in the decision-making process. Other factors which could impact the stock prices include market risks, regulatory risks, interest rate risks, currency risks, social and political instability risks etc.
Note 4: How to Read the Charts?
The Yellow color line reflects the 20-period moving average. SMA helps to identify existing price trends. If the prices are trading above the 20-period moving average, then it shows prices are currently trading in a bullish trend.
The Purple color line in the chart’s lower segment reflects the Relative Strength Index (14-Period) which indicates price momentum and signals momentum in trend. A reading of 70 or above suggests overbought status while a reading of 30 or below suggests an oversold status.
The Ink Blue color lines are the trend lines drawn by connecting two or more price points and used for trend identification purposes. The trend line also acts as a line of support and resistance.
Technical Indicators Defined: -
Support: A level at which the stock prices tend to find support if they are falling, and a downtrend may take a pause backed by demand or buying interest. Support 1 refers to the nearby support level for the stock and if the price breaches the level, then Support 2 may act as the crucial support level for the stock.
Resistance: A level at which stock prices tend to find resistance when they are rising, and an uptrend may take a pause due to profit booking or selling interest. Resistance 1 refers to the nearby resistance level for the stock and if the price surpasses the level, then Resistance 2 may act as the crucial resistance level for the stock.
Stop-loss: It is a level to protect against further losses in case of unfavorable movement in the stock prices.
The reference date for all price data, currency, technical indicators, support, and resistance levels is 28 October, 2025. The reference data in this report has been partly sourced from REFINITIV.
Abbreviations
CMP: Current Market Price
SMA: Simple Moving Averages
CAD: Canadian Dollar
RSI: Relative Strength Index
USD: United States dollar
Note: Trading decisions require a thorough analysis by individuals. Technical reports in general chart out metrics that may be assessed by individuals before any stock evaluation. The above are illustrative analytical factors used for evaluating stocks; other parameters can be looked at along with additional risks per se. Past performance is neither an indicator nor a guarantee of future performance.

 Please wait processing your request...