Company Overview:
Anfield Energy, Inc. (TSXV: AEC) engages in the exploration, development, and production of energy metals. Its projects include Shootaring Canyon Mill, Velvet Wood, Frank M, Slick Rock, Findlay Tank Breccia Pipes, West Slope, Date Creek Basin, and Marquez-Juan Tafoya Uranium. The company was founded on December 9, 1986 and is headquartered in Burnaby, Canada.
This Report covers the Price Action, Technical Indicators Analysis along with the Support Levels, Resistance Levels, and Recommendations on this stock.
Fundamental Highlights:
- Key Catalyst: Shootaring Canyon Mill Reactivation: The Shootaring Canyon Mill is one of only three licensed uranium mills in the U.S. Anfield’s reactivation plan with Utah’s Department of Environmental Quality is underway, aiming to upgrade the facility from standby to operational status. Once approved, mill throughput capacity will rise from 750 to 1,000 tpd and licensed annual production from 1Mlbs to 3Mlbs U₃O₈. The addition of a vanadium circuit offers an attractive secondary revenue stream.
- Pipeline Expansion through Marquez-Juan Tafoya Project: The Marquez-Juan Tafoya project in New Mexico, acquired from enCore Energy, adds 18.1Mlbs of indicated uranium resources at 0.127% grade. It is AEC’s largest single uranium resource and strengthens its long-term production portfolio. The asset provides geographic diversification, potential future mill feed, and fits AEC’s strategy of acquiring advanced-stage, historically significant uranium projects.
- Clear Path to Production and Growth: Anfield’s near-term focus is on restarting the Shootaring Mill and advancing Velvet-Wood and Slick Rock toward production. Medium-term plans target a PEA for West Slope, while longer-term goals include expanding DOE leases and advancing secondary projects like Marquez-Juan Tafoya. This phased approach positions Anfield to transition from developer to producer within the strengthening U.S. uranium market.
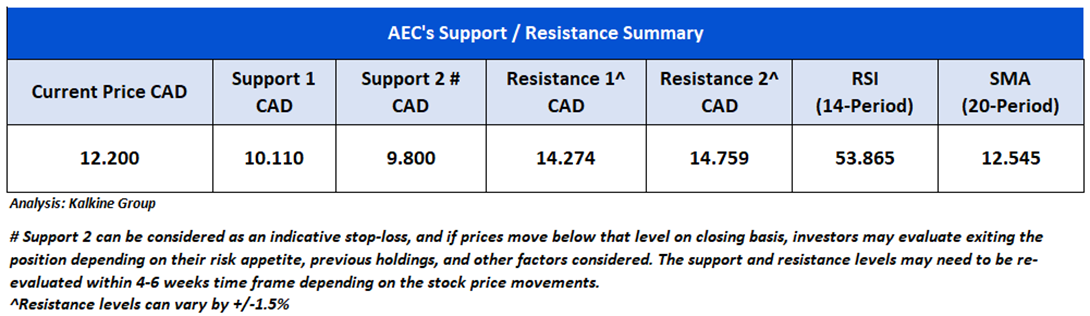
AEC’s Technical Observation:
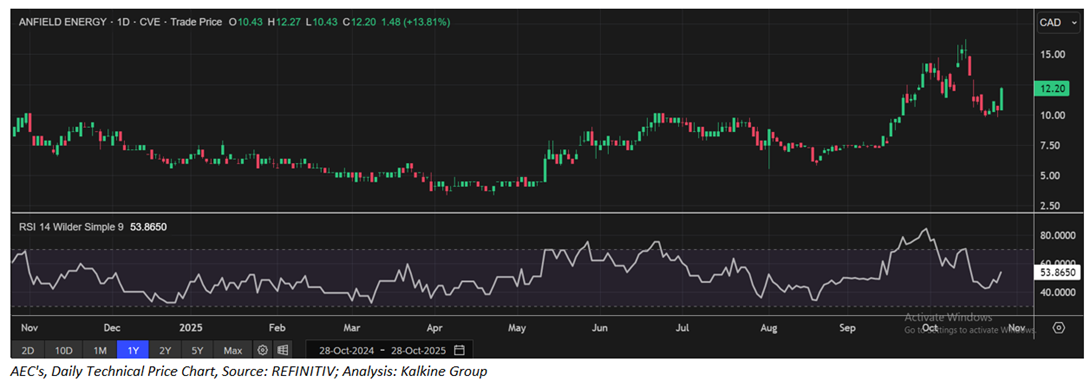
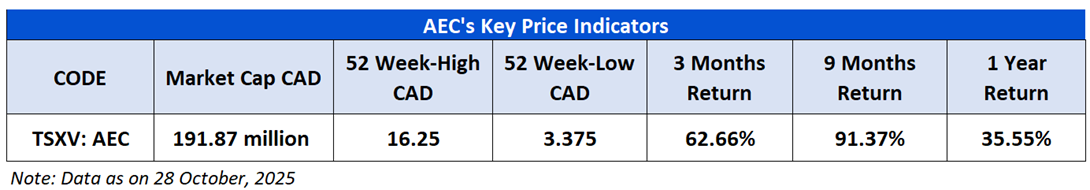
AEC is trading at CAD 12.20, up 13.81% from the previous close. The stock has staged a decent rebound after recent consolidation, maintaining its uptrend from early 2025 when it traded near CAD 3.00. Momentum remains positive, with the price holding well above key short-term support near CAD 10. The RSI at 53.865 indicates steady buying interest without signs of overextension. Overall, AEC continues to exhibit a bullish setup, supported by healthy recovery, rising volume, and healthy technical momentum.

AEC’s Daily Price Chart
As per the above-mentioned price action and technical indicators analysis, a ‘Speculative Buy’ rating has been given Anfield Energy, Inc. (TSXV: AEC) at the closing market price of CAD 12.20, as of 28 October, 2025.
Individuals can evaluate the stock based on the support and resistance levels provided in the report in case of keen interest taking into consideration the risk-reward scenario.
Markets are trading in a highly volatile zone currently due to certain Macro & Micro-economic data and prevailing geopolitical tensions. Therefore, it is prudent to follow a cautious approach while investing.
Note 1: Past performance is not a reliable indicator of future performance.
Note 2: Investment decisions should be made depending on an individual’s appetite for upside potential, risks, and any previous holdings. This recommendation is purely based on technical analysis, and fundamental analysis has not been considered in this report. Individuals can consider exiting from the stock if the Target Price or Stop loss mentioned as per the technical analysis has been achieved and is subject to the factors discussed above.
Note 3: Related Risks: This report may be looked at from a high-risk perspective and recommendations are provided for a short duration. Recommendations provided in this report are solely based on technical parameters, and the fundamental performance of the stocks has not been considered in the decision-making process. Other factors which could impact the stock prices include market risks, regulatory risks, interest rate risks, currency risks, social and political instability risks etc.
Note 4: How to Read the Charts?
The Yellow color line reflects the 20-period moving average. SMA helps to identify existing price trends. If the prices are trading above the 20-period moving average, then it shows prices are currently trading in a bullish trend.
The Purple color line in the chart’s lower segment reflects the Relative Strength Index (14-Period) which indicates price momentum and signals momentum in trend. A reading of 70 or above suggests overbought status while a reading of 30 or below suggests an oversold status.
The Ink Blue color lines are the trend lines drawn by connecting two or more price points and used for trend identification purposes. The trend line also acts as a line of support and resistance.
Technical Indicators Defined: -
Support: A level at which the stock prices tend to find support if they are falling, and a downtrend may take a pause backed by demand or buying interest. Support 1 refers to the nearby support level for the stock and if the price breaches the level, then Support 2 may act as the crucial support level for the stock.
Resistance: A level at which stock prices tend to find resistance when they are rising, and an uptrend may take a pause due to profit booking or selling interest. Resistance 1 refers to the nearby resistance level for the stock and if the price surpasses the level, then Resistance 2 may act as the crucial resistance level for the stock.
Stop-loss: It is a level to protect against further losses in case of unfavorable movement in the stock prices.
The reference date for all price data, currency, technical indicators, support, and resistance levels is 28 October, 2025. The reference data in this report has been partly sourced from REFINITIV.
Abbreviations
CMP: Current Market Price
SMA: Simple Moving Averages
CAD: Canadian Dollar
RSI: Relative Strength Index
USD: United States dollar
Note: Trading decisions require a thorough analysis by individuals. Technical reports in general chart out metrics that may be assessed by individuals before any stock evaluation. The above are illustrative analytical factors used for evaluating stocks; other parameters can be looked at along with additional risks per se. Past performance is neither an indicator nor a guarantee of future performance.

 Please wait processing your request...