Company Overview:
Sailfish Royalty Corp. (TSXV: FISH) is a precious metals royalty and streaming company. Within Sailfish's portfolio are two cornerstone assets on advanced stage projects in the Americas: a gold stream equivalent to a 3% NSR on the San Albino gold project (~3.5 sq. km) and a 2% NSR on the rest of the area (~134.5 sq. km) surrounding San Albino in northern Nicaragua; and an up to 3.5% NSR on the Tocantinzinho gold project in the prolific Tapajos district of northern Brazil. The acquisition of Terraco Gold Corp. adds a potential cornerstone asset: an up to 3% NSR on the multi-million ounce Spring Valley gold project in Pershing County, Nevada.
This Report covers the Price Action, Technical Indicators Analysis along with the Support Levels, Resistance Levels, and Recommendations on this stock.
Fundamental Highlights:
- Notable Expansion in Core Royalty Revenue: Sailfish demonstrated substantial growth in its fundamental business, with royalty revenue soaring to USD 626,603 for Q2 2025, a marked increase from USD 167,844 in the same period last year. This 273% year-over-year growth for the quarter indicates strengthening cash flow generation from its royalty and stream portfolio.
- Decent Profitability and Improved Margins: The company reported a gross profit of USD 687,330 for the second quarter, representing a significant improvement over the USD 565,681 earned in Q2 2024. This 21% increase highlights enhanced operational efficiency and stronger underlying profitability from its revenue-generating assets.
- Commitment to Shareholder Returns Through Capital Allocation: Management continues to demonstrate a disciplined capital allocation strategy focused on direct shareholder returns. The company consistently paid quarterly dividends and actively repurchased shares, cancelling 529,300 common shares in the first half of 2025. This balanced approach returns capital to shareholders while potentially increasing the ownership stake of remaining investors.
- Strategic Portfolio Enhancement with Gavilanes Royalty Conversion: Subsequent to the quarter, the successful conversion of the Gavilanes Property into a 2% Net Smelter Return royalty is a strategically positive move. This transaction transforms a non-producing asset into a long-term, passive royalty interest, aligning with the company's capital-light business model and creating a new, perpetual revenue stream without future capital requirements.
FISH’s Technical Observation:
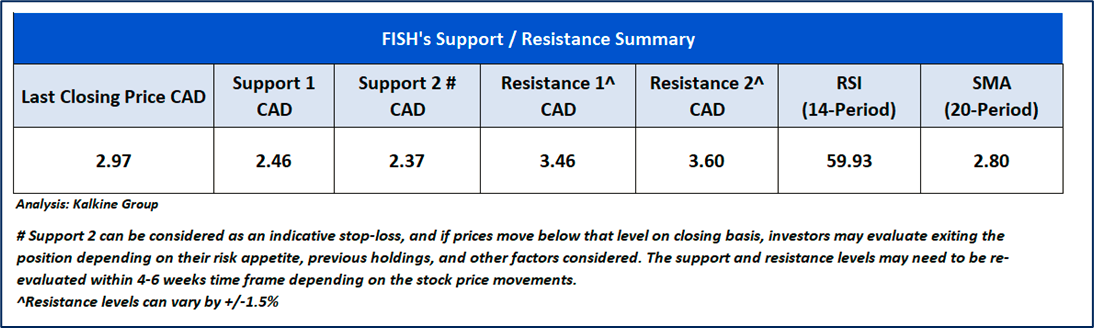
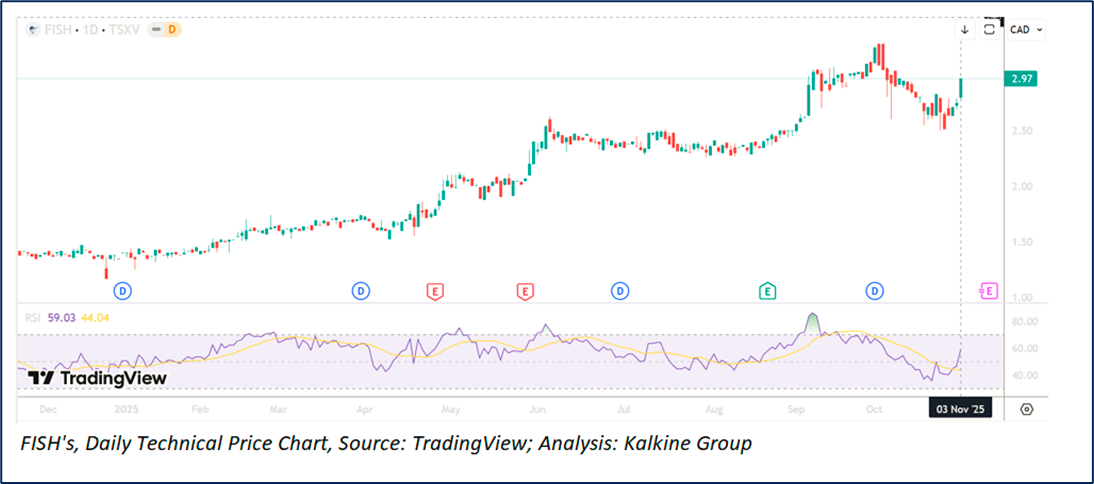
FISH is trading at CAD 2.97, up by 8.79%. The stock has seen a sharp rally over the past few weeks, surging from below CAD 2.32 in mid-2025 to a recent high above CAD 3.26, indicating decent upward momentum. The price currently remains above its short-term support level around CAD 2.46, suggesting that the bullish trend is still intact despite the recent pullback. Overall, FISH continues to show bullish sentiment in the medium term, supported by recent gains and price action above key short-term levels.

FISH’s Daily Price Chart
As per the above-mentioned price action and technical indicators analysis, a ‘Speculative Buy’ rating has been given Sailfish Royalty Corp. (TSXV: FISH) at the Last Closing Price of CAD 2.97, as on 03 November 2025.
Individuals can evaluate the stock based on the support and resistance levels provided in the report in case of keen interest taking into consideration the risk-reward scenario.
Markets are trading in a highly volatile zone currently due to certain Macro & Micro-economic data and prevailing geopolitical tensions. Therefore, it is prudent to follow a cautious approach while investing.
Note 1: Past performance is not a reliable indicator of future performance.
Note 2: Investment decisions should be made depending on an individual’s appetite for upside potential, risks, and any previous holdings. This recommendation is purely based on technical analysis, and fundamental analysis has not been considered in this report. Individuals can consider exiting from the stock if the Target Price or Stop loss mentioned as per the technical analysis has been achieved and is subject to the factors discussed above.
Note 3: Related Risks: This report may be looked at from a high-risk perspective, and recommendations are provided for a short duration. Recommendations provided in this report are solely based on technical parameters, and the fundamental performance of the stocks has not been considered in the decision-making process. Other factors which could impact the stock prices include market risks, regulatory risks, interest rate risks, currency risks, social and political instability risks etc.
Note 4: How to Read the Charts?
The Yellow color line reflects the 20-period moving average. SMA helps to identify existing price trends. If the prices are trading above the 20-period moving average, then it shows prices are currently trading in a bullish trend.
The Purple color line in the chart’s lower segment reflects the Relative Strength Index (14-Period) which indicates price momentum and signals momentum in trend. A reading of 70 or above suggests overbought status while a reading of 30 or below suggests an oversold status.
The Ink Blue color lines are the trend lines drawn by connecting two or more price points and used for trend identification purposes. The trend line also acts as a line of support and resistance.
Technical Indicators Defined: -
Support: A level at which stock prices tend to find support if they fall, and a downtrend may take a pause backed by demand or buying interest. Support 1 refers to the nearby support level for the stock and if the price breaches the level, then Support 2 may act as the crucial support level for the stock.
Resistance: A level at which stock prices tend to find resistance when they are rising, and an uptrend may take a pause due to profit booking or selling interest. Resistance 1 refers to the nearby resistance level for the stock and if the price surpasses the level, then Resistance 2 may act as the crucial resistance level for the stock.
Stop-loss: It is a level to protect against further losses in case of unfavorable movement in the stock prices.
The reference date for all price data, currency, technical indicators, support, and resistance levels is 03 November 2025. The reference data in this report has been partly sourced from REFINITIV.
Abbreviations
CMP: Current Market Price
SMA: Simple Moving Averages
CAD: Canadian Dollar
RSI: Relative Strength Index
USD: United States dollar
Note: Trading decisions require a thorough analysis by individuals. Technical reports in general chart out metrics that may be assessed by individuals before any stock evaluation. The above are illustrative analytical factors used for evaluating stocks; other parameters can be looked at along with additional risks per se. Past performance is neither an indicator nor a guarantee of future performance.

 Please wait processing your request...