Company Overview:
Mkango Resources Ltd. (TSXV: MKA) is engaged in exploration for rare earth elements and associated minerals in the Republic of Malawi. The company holds interests in four exclusive prospecting licenses in Malawi namely the Phalombe licence, the Thambani licence, the Chimimbe Hill licence and the Mchinji licence. The main exploration target in the 51% held Phalombe licence is the Songwe Hill rare earths deposit. The main exploration targets in Mkango's remaining three 100% held licences are, in the Thambani licence, uranium, niobium, tantalum and zircon, in the Chimimbe Hill licence, nickel and cobalt, and in the Mchinji licence, rutile, nickel, cobalt, base metals and graphite.
This Report covers the Price Action, Technical Indicators Analysis along with the Support Levels, Resistance Levels, and Recommendations on this stock.
Fundamental Highlights:
- Advancement in Near-Term Revenue Generation: The production of 905kg of recycled NdFeB alloy powder and progress toward sintered magnets mark a key operational milestone. This moves the initiative from development into a pre-revenue state, preparing the initial product for market entry.
- Strategic Execution on Global Expansion Plans: The German plant's progress and a USD 92 million EXIM Bank letter for a Texas facility demonstrate a well-executed multinational strategy. This confirms adherence to timelines and strong backing from major international financiers for the company's expansion.
- Establishment of a Secure Feedstream for US Operations: The feedstock agreement with Intelligent Lifecycle Solutions secures a vital raw material supply for the Texas facility. This proactively mitigates a key production bottleneck before the plant's commissioning.
- Enhancement of Financial Flexibility: The exercise of investor warrants has provided capital, and 16.6 million in-the-money warrants remain. These represent a key source of near-term, non-dilutive funding, extending the financial runway without immediate equity market reliance.
MKA’s Technical Observation:
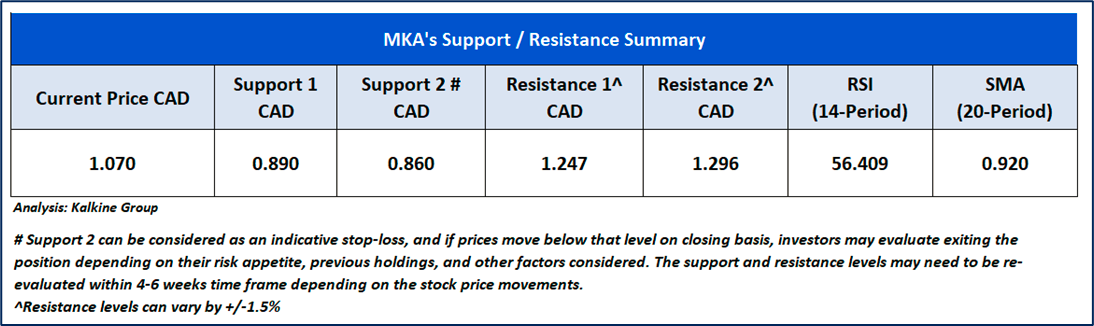
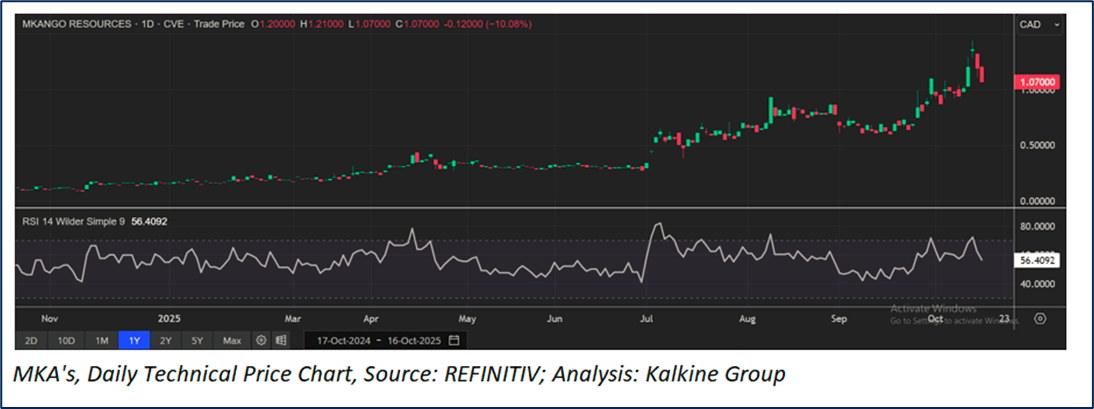
MKA is trading at CAD 1.07, down by 10.08% from the previous close. The stock has seen a sharp rally over the past few weeks, surging from below CAD 0.61 in mid-2025 to a recent high above CAD 0.67, indicating decent upward momentum. The price currently remains above its short-term support level around CAD 0.87, suggesting that the bullish trend is still intact despite the recent pullback. Overall, MKA continues to show bullish sentiment in the medium term, supported by recent gains and price action above key short-term levels.

MKA’s Daily Price Chart
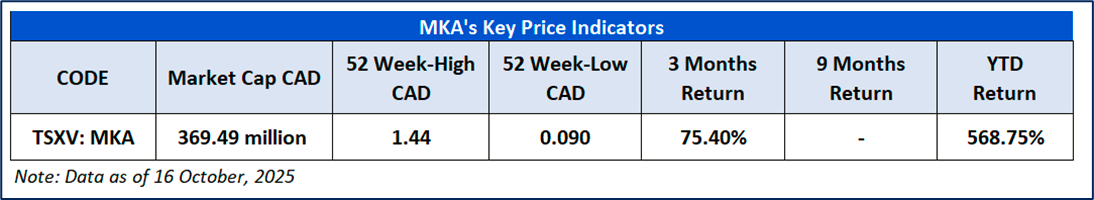
As per the above-mentioned price action and technical indicators analysis, a ‘Speculative Buy’ rating has been given Mkango Resources Ltd. (TSXV: MKA) at the Last Closing Price of CAD 1.07, as on 16 October 2025.
Individuals can evaluate the stock based on the support and resistance levels provided in the report in case of keen interest taking into consideration the risk-reward scenario.
Markets are trading in a highly volatile zone currently due to certain Macro & Micro-economic data and prevailing geopolitical tensions. Therefore, it is prudent to follow a cautious approach while investing.
Note 1: Past performance is not a reliable indicator of future performance.
Note 2: Investment decisions should be made depending on an individual’s appetite for upside potential, risks, and any previous holdings. This recommendation is purely based on technical analysis, and fundamental analysis has not been considered in this report. Individuals can consider exiting from the stock if the Target Price or Stop loss mentioned as per the technical analysis has been achieved and is subject to the factors discussed above.
Note 3: Related Risks: This report may be looked at from a high-risk perspective, and recommendations are provided for a short duration. Recommendations provided in this report are solely based on technical parameters, and the fundamental performance of the stocks has not been considered in the decision-making process. Other factors which could impact the stock prices include market risks, regulatory risks, interest rate risks, currency risks, social and political instability risks etc.
Note 4: How to Read the Charts?
The Yellow color line reflects the 20-period moving average. SMA helps to identify existing price trends. If the prices are trading above the 20-period moving average, then it shows prices are currently trading in a bullish trend.
The Purple color line in the chart’s lower segment reflects the Relative Strength Index (14-Period) which indicates price momentum and signals momentum in trend. A reading of 70 or above suggests overbought status while a reading of 30 or below suggests an oversold status.
The Ink Blue color lines are the trend lines drawn by connecting two or more price points and used for trend identification purposes. The trend line also acts as a line of support and resistance.Technical Indicators Defined: -
Support: A level at which stock prices tend to find support if they fall, and a downtrend may take a pause backed by demand or buying interest. Support 1 refers to the nearby support level for the stock and if the price breaches the level, then Support 2 may act as the crucial support level for the stock.
Resistance: A level at which stock prices tend to find resistance when they are rising, and an uptrend may take a pause due to profit booking or selling interest. Resistance 1 refers to the nearby resistance level for the stock and if the price surpasses the level, then Resistance 2 may act as the crucial resistance level for the stock.
Stop-loss: It is a level to protect against further losses in case of unfavorable movement in the stock prices.
The reference date for all price data, currency, technical indicators, support, and resistance levels is 16 October 2025. The reference data in this report has been partly sourced from REFINITIV.
Abbreviations
CMP: Current Market Price
SMA: Simple Moving Averages
CAD: Canadian Dollar
RSI: Relative Strength Index
USD: United States dollar
Note: Trading decisions require a thorough analysis by individuals. Technical reports in general chart out metrics that may be assessed by individuals before any stock evaluation. The above are illustrative analytical factors used for evaluating stocks; other parameters can be looked at along with additional risks per se. Past performance is neither an indicator nor a guarantee of future performance.

 Please wait processing your request...