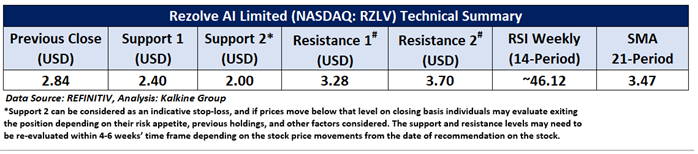
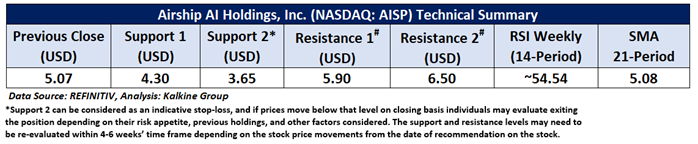
Company Overview: Rezolve AI Limited (NASDAQ: RZLV) is a provider of artificial intelligence (AI)-driven engagement platforms for retail and commerce. The company enables retailers, brands, and manufacturers to create dynamic connections with consumers across mobile and desktop devices. Its AI-driven platform simplifies the purchasing process, providing relevant information and facilitating seamless transactions with a single tap. Airship AI Holdings, Inc. (NASDAQ: AISP) is a technology company. The company offers an artificial intelligence (AI)-driven video, sensor and data management surveillance platform that improves public safety and operational efficiency for public sector and commercial customers by providing predictive analysis of events before they occur. This Report covers the Price Action, Technical Indicators Analysis along with the Support Levels, Resistance Levels, and Recommendations on these stocks.
RZLV’s Technical Analysis:
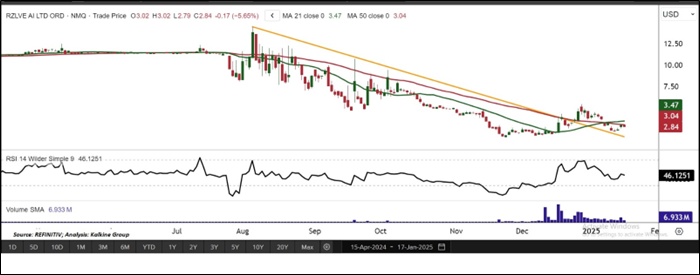
On the daily chart, RZLV's prices are trading above the descending trendline resistance zone, while also holding above a key horizontal support level. Moreover, the 14-period Relative Strength Index (RSI) is at 54.54, suggesting neutral to slightly bullish momentum, the prices are trading below the trend-following indicator 21-period SMA, which may act as a resistance level. An important support level for the stock is seen at USD 2.40 and USD 2.00, while the key resistance level is placed at USD 3.28 and USD 3.70.

Daily Technical Chart – RZLV
Considering the stock’s current trading volume, momentum oscillator analysis, and its position above the descending trendline resistance level, a “Speculative Buy” recommendation is given on the stock. `````The stock was analysed as per the closing price of USD 2.84 per share as on 17th January 2025, down by 5.65%.
AISP’s Technical Analysis:
On the daily chart, AISP's stock is trading below both the horizontal trendline resistance zone and the descending trendline resistance level, signalling a bearish outlook. The 14-period Relative Strength Index (RSI) stands at 54.54, showing a shift from bullish to bearish momentum. Prices are also above both the 21-period and 50-period Simple Moving Averages (SMA), which may act as support levels. Key support levels are at USD 4.30 and USD 3.65, while resistance is seen at USD 5.90 and USD 6.50.

Daily Technical Chart – AISP
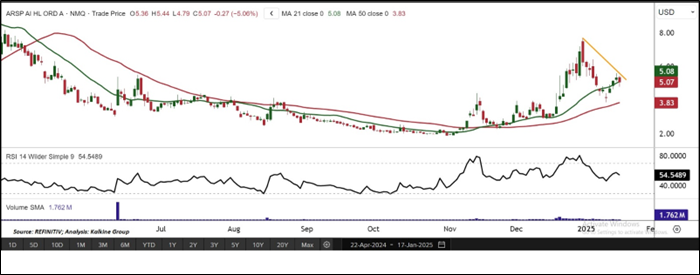
Considering the stock’s current trading volume, momentum oscillator analysis, and its position below the descending trendline support, a “watch” recommendation is given on the stock. The stock was analysed as per the closing price of USD 5.07 per share as on 17th January 2025, down by 5.06%.
Individuals can evaluate the stock based on the support and resistance levels provided in the report in case of keen interest, taking into consideration the risk-reward scenario.
Markets are trading in a highly volatile zone currently due to certain macro-economic issues and prevailing geopolitical tensions. Therefore, it is prudent to follow a cautious approach while investing.
Related Risk: This report may be looked at from a high-risk perspective and a recommendation is provided for a short duration. This report is solely based on technical parameters, and the fundamental performance of the stocks has not been considered in the decision-making process. Other factors which could impact the stock prices include market risks, regulatory risks, interest rates risks, currency risks, social and political instability risks etc.
Note 1: Past performance is not a reliable indicator of future performance.
Note 2: The reference date for all price data, currency, technical indicators, support, and resistance level is January 17th, 2025. The reference data in this report has been partly sourced from REFINITIV.
Note 3: Investment decisions should be made depending on an individual's appetite for upside potential, risks, holding duration, and any previous holdings. An 'Exit' from the stock can be considered if the Target Price mentioned as per the Valuation and or the technical levels provided has been achieved and is subject to the factors discussed above.
Note 4: Target Price refers to a price level that the stock is expected to reach as per the relative valuation method and or technical analysis taking into consideration both short-term and long-term scenarios.
Note 5: ‘Kalkine reports are prepared based on the stock prices captured either from the New York Stock Exchange (NYSE), NASDAQ Capital Markets (NASDAQ), and or REFINITIV. Typically, all sources (NYSE, NASDAQ, or REFINITIV) may reflect stock prices with a delay which could be a lag of 15-20 minutes. There can be no assurance that future results or events will be consistent with the information provided in the report. The information is subject to change without any prior notice.
Technical Indicators Defined:
Support: A level at which the stock prices tend to find support if they are falling, and a downtrend may take a pause backed by demand or buying interest. Support 1 refers to the nearby support level for the stock and if the price breaches the level, then Support 2 may act as the crucial support level for the stock.
Resistance: A level at which the stock prices tend to find resistance when they are rising, and anuptrend may take a pause due to profit booking or selling interest. Resistance 1 refers to the nearby resistance level for the stock and if the price surpasses the level, then Resistance 2 may act as the crucial resistance level for the stock.
Stop-loss: It is a level to protect further losses in case of unfavourable movement in the stock prices.

 Please wait processing your request...