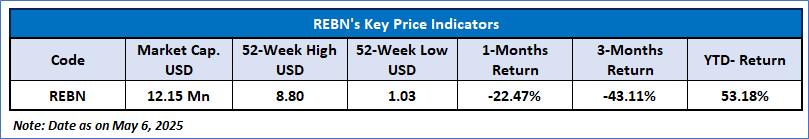
Reborn Coffee, Inc. (NASDAQ: REBN)
Reborn Coffee, Inc. (NASDAQ: REBN) is a retailer of specialty coffee. The Company, through its subsidiary, Reborn Global Holdings, Inc., is engaged in the operation of wholesale distribution and retail coffee stores in California to sell a variety of coffee, tea, Reborn brand name water and other beverages along with bakery and dessert products.
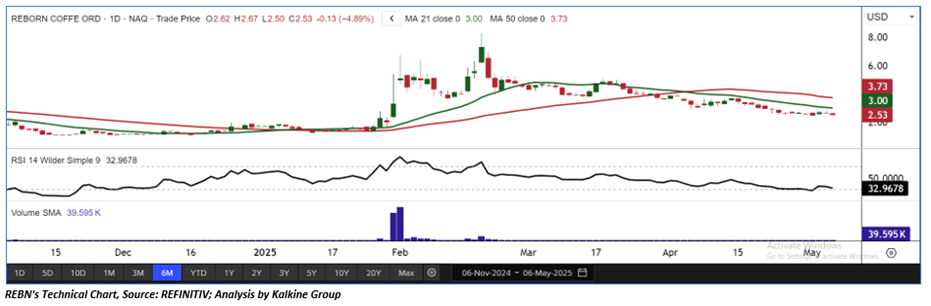
Technical Observation (on the daily chart):
REBN is undergoing a period of price compression, pointing to a likely extended consolidation phase with a clear downward bias. The 14-period RSI, positioned below 50 and showing limited directional conviction, supports this negative outlook, as does the stock trading below its 21-period SMA. A break above its resistance zone is needed to trigger further buying; until that happens, consolidation is expected. Significant support and resistance levels are set to influence future supply and demand.
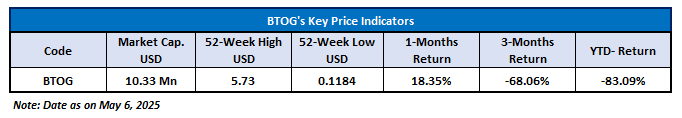
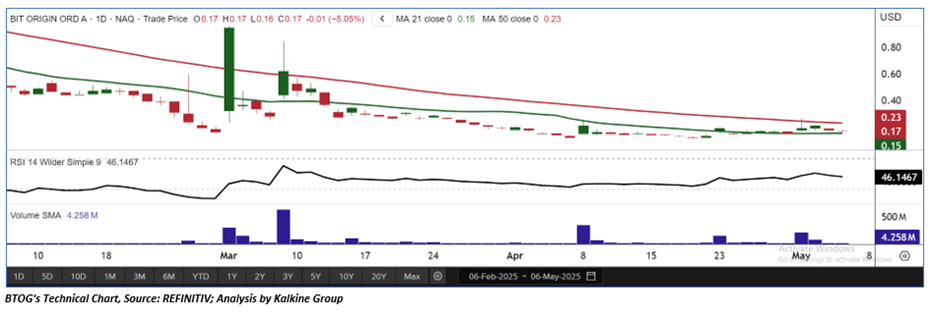
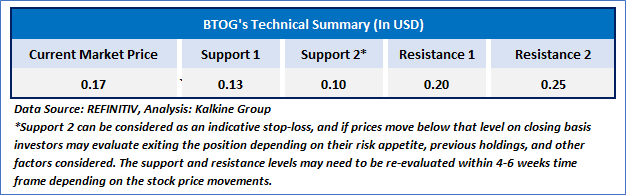
Bit Origin Ltd (NASDAQ: BTOG)
Bit Origin Ltd (NASDAQ: BTOG) is a holding company. The Company through its subsidiary, SonicHash LLC (SonicHash US), it is engaged in Bitcoin mining in the United States.
Technical Observation (on the daily chart):
BTOG's price is tightening, suggesting a likely extended period of consolidation with a clear downward bias. This negative outlook is supported by the 14-period RSI, which is below 50 and lacks strong directional conviction, and the stock trading below its 21-period SMA. Further buying is anticipated only after price breaks above its resistance zone; until then, consolidation is expected. Significant support and resistance levels are poised to influence future supply and demand dynamics.
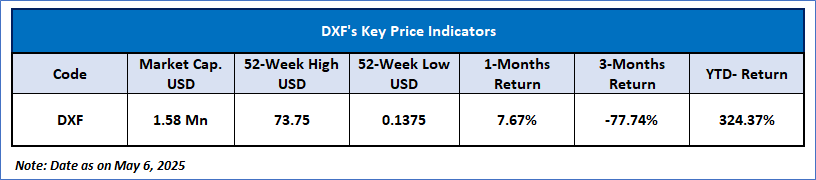
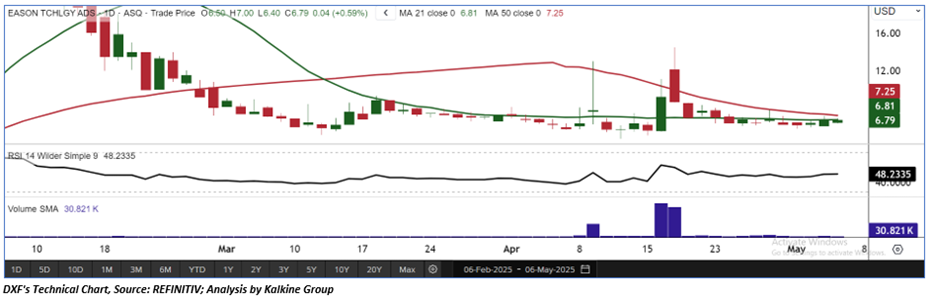
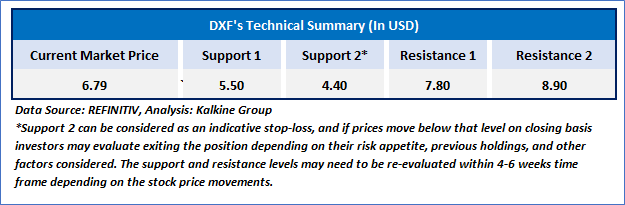
Eason Technology Ltd, (NYSE: DXF)
Eason Technology Ltd, (NYSE: DXF) formerly Dunxin Financial Holdings Ltd, is an investment holding company primarily engaged in the real estate operation management and investment business as well as digital security technology business
Technical Observation (on the daily chart):
DXF's price is encountering resistance even at lower levels while attempting to climb. However, given the significant overarching downtrend, the stock could experience increased volatility in the near term. The 14-period RSI, below 50 and lacking clear direction, reinforces this bearish perspective. The stock's trading around its 50-period SMA may hinder upward movement. Further buying is expected only after price breaks through these key resistance points; until then, consolidation within a limited range is likely. Significant support and resistance levels will be crucial in determining future supply and demand dynamics.
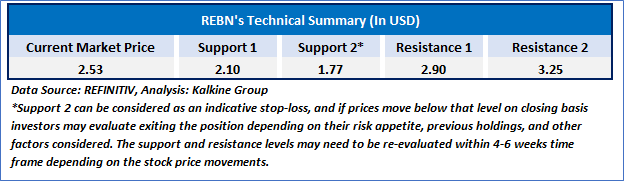
Individuals can evaluate the stock based on the support and resistance levels provided in the report in case of keen interest taking into consideration the risk-reward scenario.
Markets are trading in a highly volatile zone currently due to certain macro-economic issues and prevailing geopolitical tensions. Therefore, it is prudent to follow a cautious approach while investing.
Related Risk: This report may be looked at from a high-risk perspective and a recommendation is provided for a short duration. This report is solely based on technical parameters, and the fundamental performance of the stocks has not been considered in the decision-making process. Other factors which could impact the stock prices include market risks, regulatory risks, interest rates risks, currency risks, social and political instability risks etc.
How to Read the Charts?
The green colour line reflects the 21-period simple moving average (SMA) while the red line indicates the 50- period simple moving average (SMA). SMA helps to identify existing price trends. If the prices are trading above the 21-period and 50-period moving average, then it shows prices are currently trading in a bullish trend.
The black colour line in the chart’s lower segment reflects the Relative Strength Index (14-Period) which indicates price momentum and signals momentum in trend. A reading of 70 or above suggests overbought status while a reading of 30 or below suggests an oversold status.
The blue colour bars in the chart’s lower segment show the volume of the stock. The volume is the number of shares that changed hands during a given day. Stocks with high volumes are more liquid than stocks with lesser volume as liquidity in stocks helps with easier and faster execution of the order.
The Orange colour lines are the trend lines drawn by connecting two or more price points and used for trend identification purposes. The trend line also acts as a line of support and resistance.
Technical Indicators Defined: -
Support: A level at which the stock prices tend to find support if they are falling, and a downtrend may take a pause backed by demand or buying interest. Support 1 refers to the nearby support level for the stock and if the price breaches the level, then Support 2 may act as the crucial support level for the stock.
Resistance: A level at which the stock prices tend to find resistance when they are rising, and an uptrend may take a pause due to profit booking or selling interest. Resistance 1 refers to the nearby resistance level for the stock and if the price surpasses the level, then Resistance 2 may act as the crucial resistance level for the stock.
Stop-loss: It is a level to protect further losses in case of unfavourable movement in the stock prices.
Past performance is neither an indicator nor a guarantee of future performance.
The reference date for all price data, currency, technical indicators, support, and resistance levels is of May 6, 2025. The reference data in this report has been partly sourced from REFINITIV.
Abbreviations
CMP: Current Market Price
SMA: Simple Moving Average
RSI: Relative Strength Index
USD: United States dollar
Note: Trading decisions require a thorough analysis by individual. Technical reports in general chart out metrics that may be assessed by individuals before any stock evaluation. The above are illustrative analytical factors used for evaluating stocks; other parameters can be looked at along with additional risks per se. Past performance is neither an indicator nor a guarantee of future performance.
_05_06_2025_19_59_43_275730.jpg)
 Please wait processing your request...