This report is an updated version of the report published on 3 February 2025 at 9:00 AM AEDT.
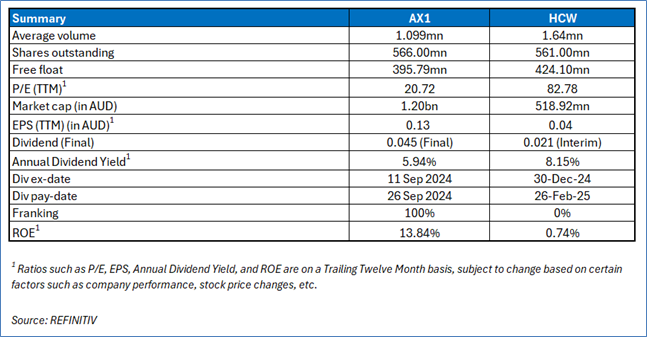
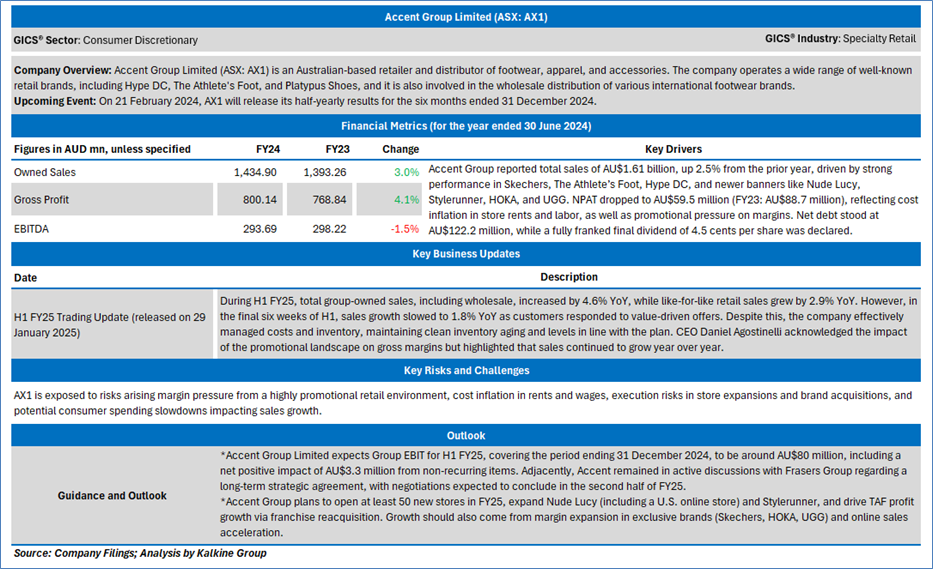
Company Overview: Accent Group Limited (ASX: AX1) is an Australian-based retailer and distributor of footwear, apparel, and accessories. The company operates a wide range of well-known retail brands, including Hype DC, The Athlete's Foot, and Platypus Shoes, and it is also involved in the wholesale distribution of various international footwear brands. HealthCo Healthcare & Wellness REIT (ASX: HCW) is an ASX-listed Real Estate Investment Trust specializing in healthcare and wellness property assets. Its aim is to offer investors exposure to a diversified portfolio driven by major healthcare sector trends, focusing on delivering stable and growing distributions, long-term capital appreciation, and positive environmental and social outcomes. Kalkine’s Daily Report covers the Key Financial Metrics, Risks, Outlook, Technical Analysis along with the Valuation, Target Price, and Recommendation on the stock.
Accent Group Limited (ASX: AX1)
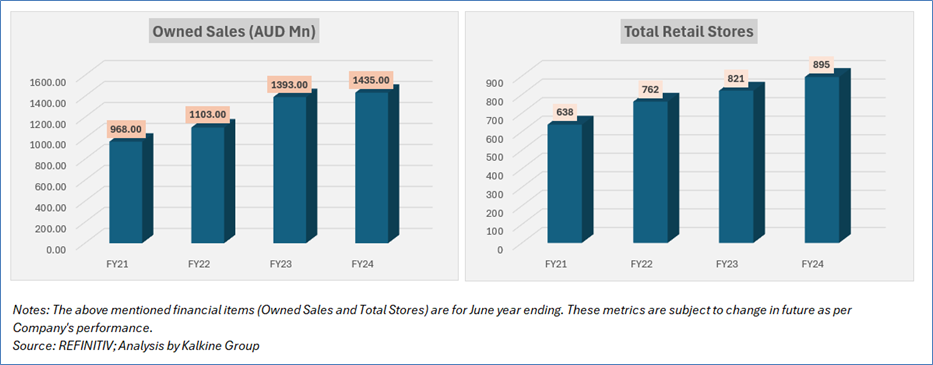
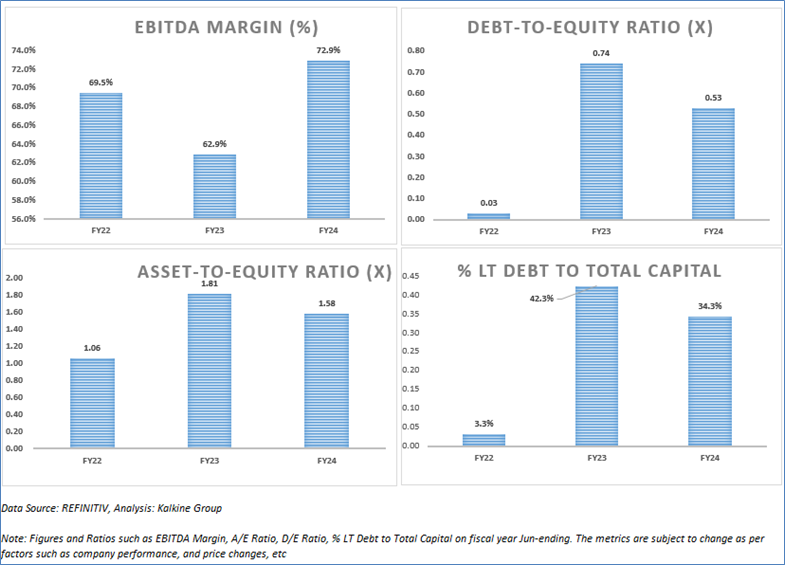
Section 1.0: Key Metrics in Pictures
Having looked at the key financial metrics above, the below sections provide in-depth fundamental, and technical analysis on this Consumer Discretionary stock along with recommendation, technical support, and resistance level & indicative stop-loss.
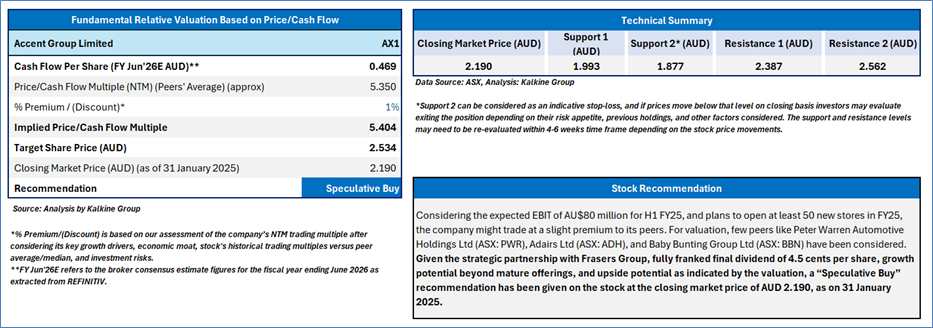
Section 2.0: Accent Group Limited (‘Speculative Buy’ at AUD 2.190, closing market price as on 31 January 2025)
2.1 Company Details
2.2 Valuation, Technical Summary & Stock Recommendation
The stock has declined by ~8.75% in the last one month, and over the last one year, it has moved up by ~4.78%. The stock has a 52-week low and 52-week high of AUD 1.735 and AUD 2.660, respectively and is currently trading below the 52-week high-low average.
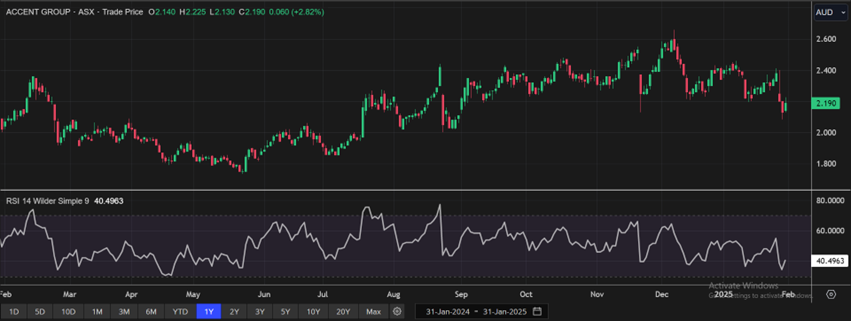
(Source: REFINITIV; Analysis by Kalkine Group)
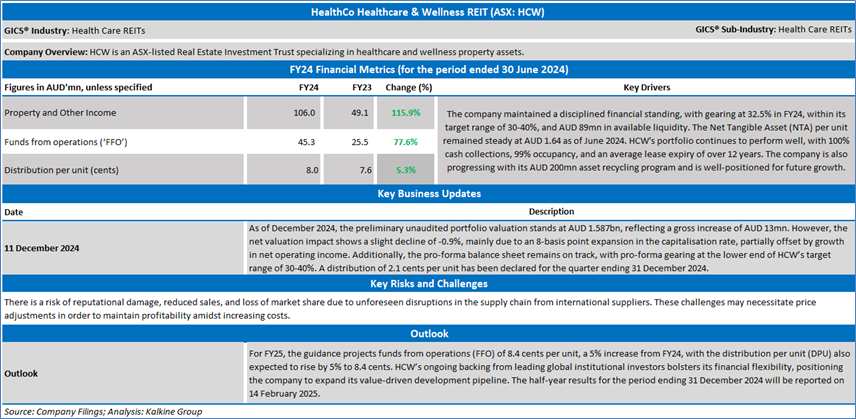
HealthCo Healthcare & Wellness REIT (ASX: HCW)
Section 1.0: Key Metrics in Pictures
Having looked at the key financial ratios above, the below sections provide an in-depth fundamental, and technical analysis on this one ASX-listed REIT stock with recommendations, technical support and resistance levels and indicative stop-loss.
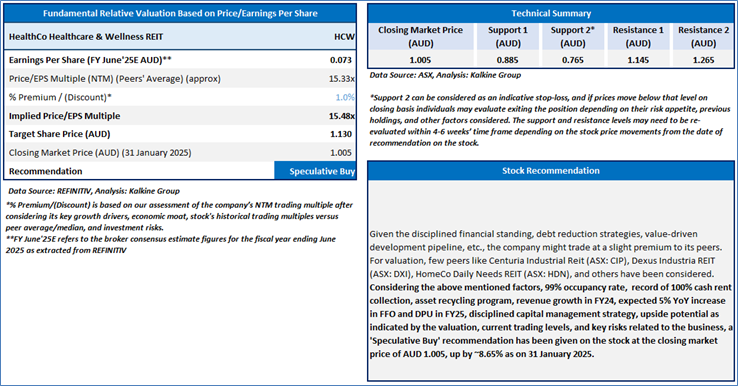
Section 2: HealthCo Healthcare & Wellness REIT (Speculative Buy’ at AUD 1.005, closing market price per share as on 31 January 2025)
2.1 Company Details
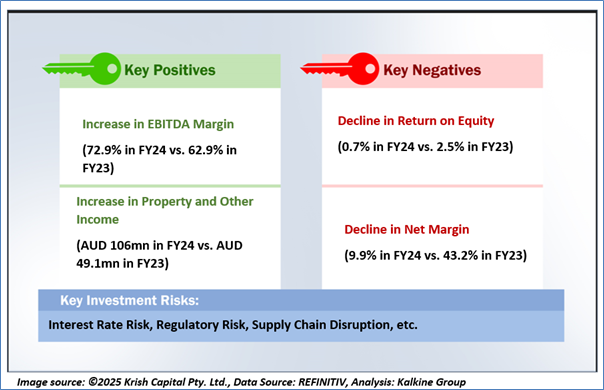
2.2 Stock Recommendation and Valuation
The stock has witnessed a dip of ~4.41 in the last one month, and over the last nine months, it has decreased by ~16.67%. The stock has a 52-week low and 52-week high of AUD 0.910 and AUD 1.455, respectively, and is currently trading below the 52-week high-low average. HCW was last covered in a report dated ’08 January 2025’.
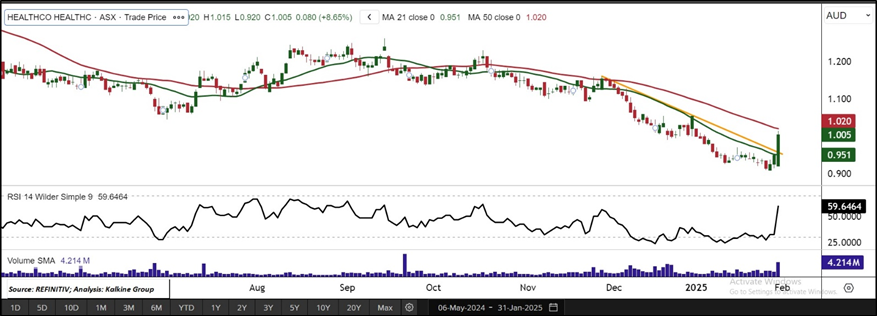
Daily Technical Chart; Source REFINITIV
Markets are trading in a highly volatile zone currently due to certain macro-economic issues and geopolitical tensions prevailing. Therefore, it is prudent to follow a cautious approach while investing.
Note 1: Past performance is neither an indicator nor a guarantee of future performance.
Note 2: The reference date for all price data, currency, technical indicators, support, and resistance levels is 3 February 2025. The reference data in this report has been partly sourced from REFINITIV.
Note 3: Investment decisions should be made depending on an individual's appetite for upside potential, risks, holding duration, and any previous holdings. An 'Exit' from the stock can be considered if the Target Price mentioned as per the Valuation and or the technical levels provided has been achieved and is subject to the factors discussed above.
Note 4: Dividend Yield may vary as per the stock price movement.
Note 5: Kalkine reports are prepared based on the stock prices captured either from REFINITIV or Trading View. Typically, REFINITIV or Trading View may reflect stock prices with a delay which could be a lag of 25-30 minutes. There can be no assurance that future results or events will be consistent with the information provided in the report. The information is subject to change without any prior notice.
Technical Indicators Defined: -
Support: A level at which the stock prices tend to find support if they are falling, and a downtrend may take a pause backed by demand or buying interest. Support 1 refers to the nearby support level for the stock and if the price breaches the level, then Support 2 may act as the crucial support level for the stock.
Resistance: A level at which the stock prices tend to find resistance when they are rising, and an uptrend may take a pause due to profit booking or selling interest. Resistance 1 refers to the nearby resistance level for the stock and if the price surpasses the level, then Resistance 2 may act as the crucial resistance level for the stock.

 Please wait processing your request...