
Section1: Company Overview
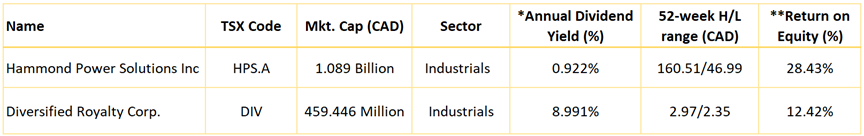
Hammond Power Solutions Inc (TSX: HPS.a) is engaged in designing and manufacturing of custom electrical magnetics, cast resin, custom liquid filled distribution and power transformers and standard electrical transformers, serving the electrical and electronic industries. The company has manufacturing plants in Canada, the United States, Mexico and India. This Report covers the Investment Highlights, Key Financial Metrics, Risks, Technical Analysis along with the Valuation, Target Price, and Recommendation on the stock.
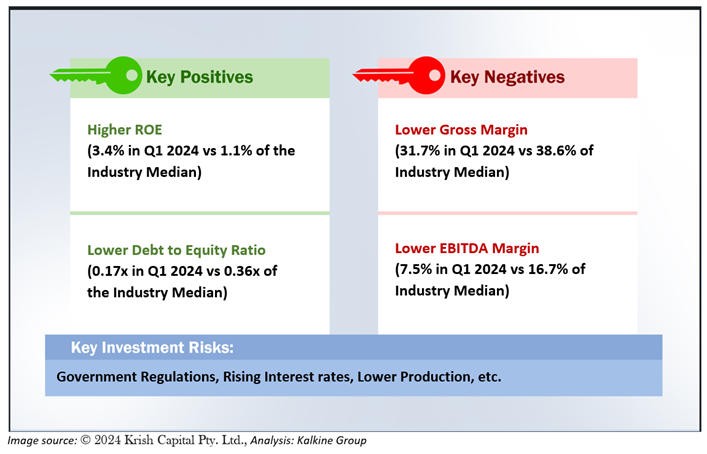
1.2 The Key Positives, Negatives, Investment Highlights, and Risks
Section2: Financial Highlights
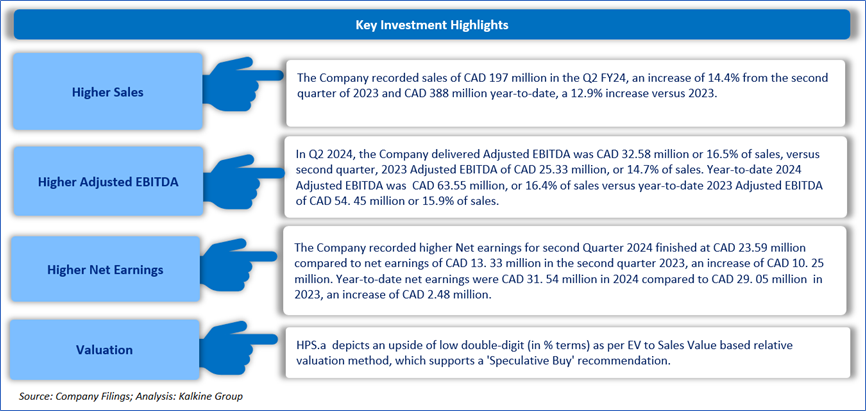
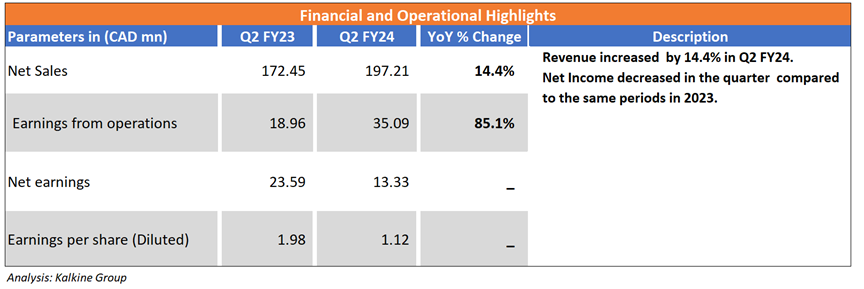
2.1 Key Financial Highlights
Section 3: Stock Recommendation Summary
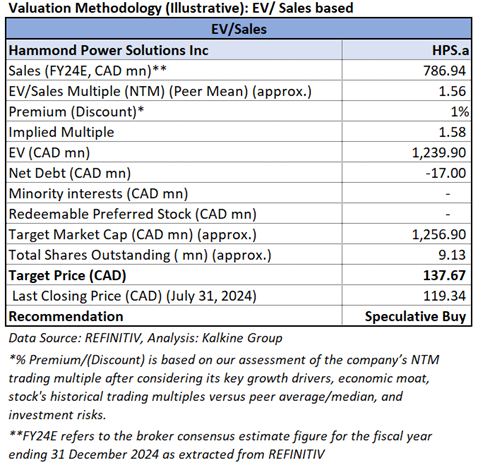
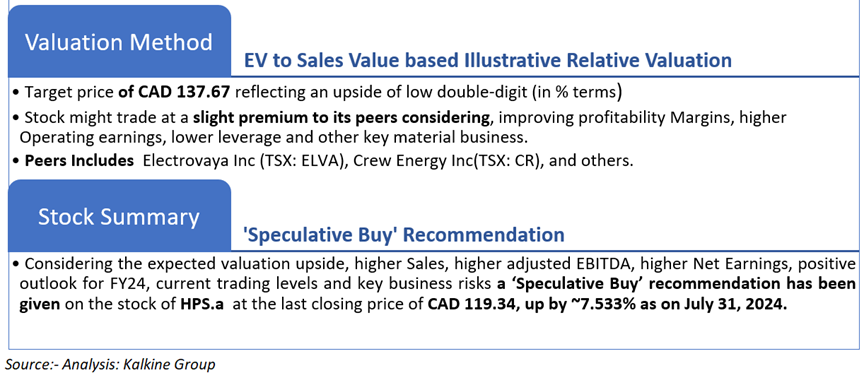
3.1 Valuation Methodology
Valuation Methodology (Illustrative): EV/ Sales based
3.2 Price Performance and Stock Recommendation

The stock has witnessed an upside of ~7.04% and of ~14.99% over the last 1 month and 3 months respectively. Moreover, the stock is trading above the average of 52-week high price of CAD 160.51 and 52-week low price of CAD 46.99 providing an opportunity to ride the trend.
3.3 One-Year Technical Price Chart
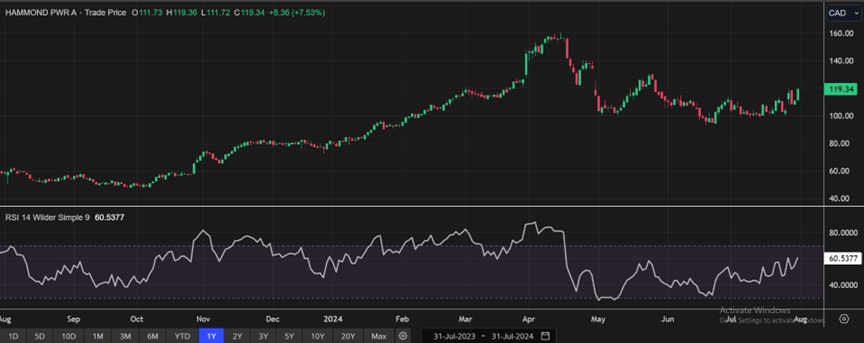
One-Year Technical Price Chart (as of July 31, 2024). Source: REFINITIV, Analysis: Kalkine Group
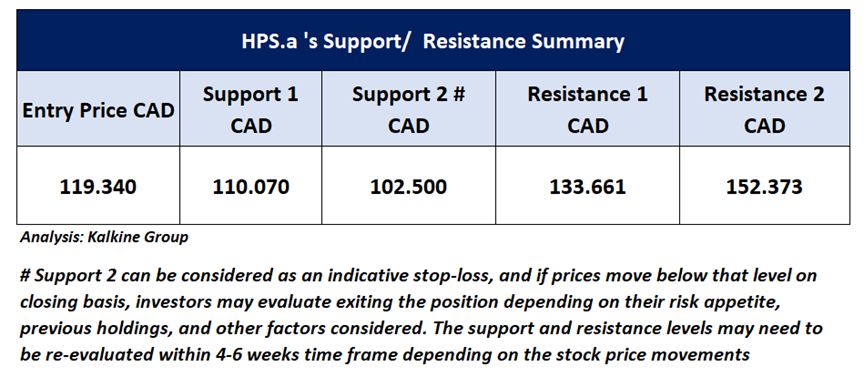
3.4 Technical Summary
Section1: Company Overview
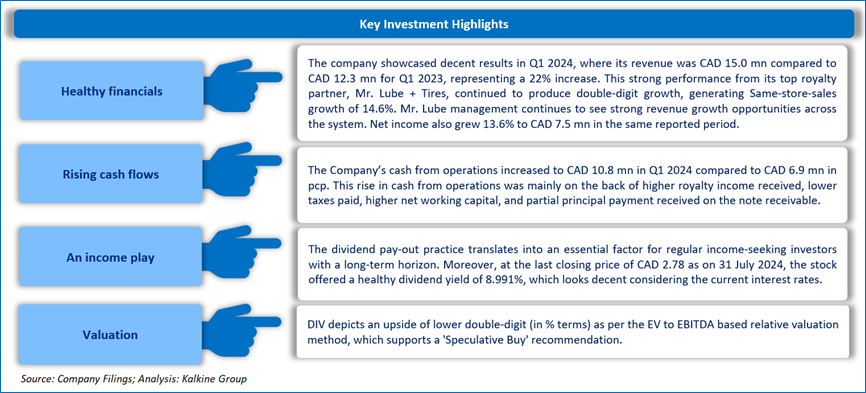
Diversified Royalty Corp. (TSX: DIV) is a multi-royalty company. It is engaged in the business of acquiring royalties from multi-location businesses and franchisors in North America. As a part of the investment strategy, the firm always purchases trademarks of the companies it is going to acquire. The company gives its partners the benefit of full operational control of their business, participation in the growth of their company, and tax deductibility on royal payments. This Report covers the Investment Highlights, Key Financial Metrics, Risks, Technical Analysis along with the Valuation, Target Price, and Recommendation on the stock.
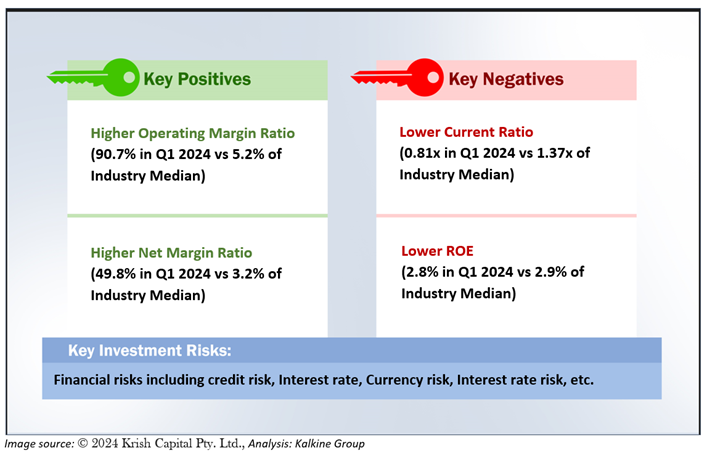
1.2 The Key Positives, Negatives, Investment Highlights, and Risks
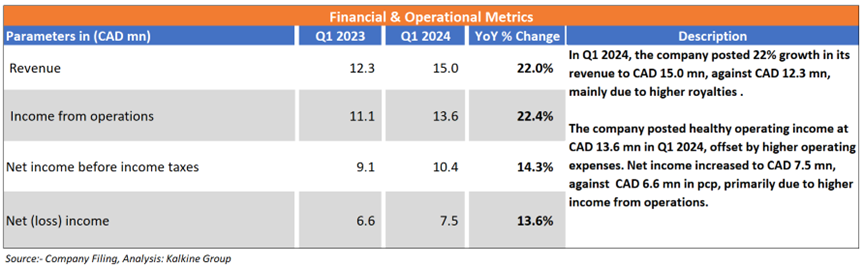
Section2: Financial Highlights
2.1 Key Financial Highlights
Section 3: Stock Recommendation Summary
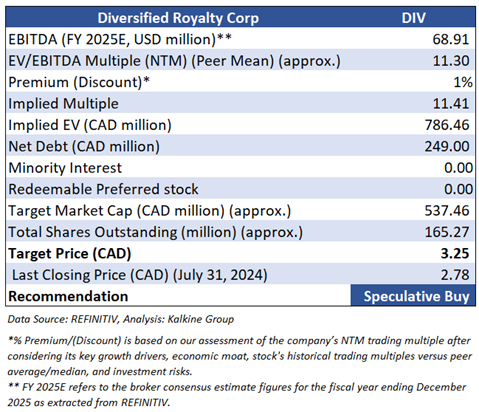
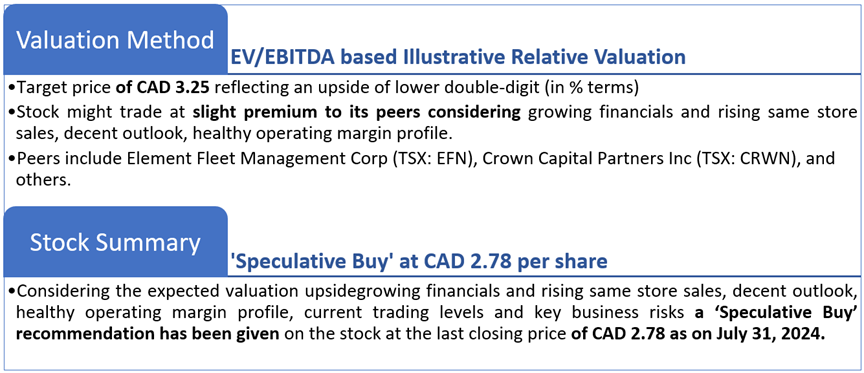
3.1 Valuation Methodology
Valuation Methodology (Illustrative): EV/ EBITDA based
3.2 Price Performance and Stock Recommendation

The stock has witnessed an upside of ~2.58% and a downside of ~0.71% over the last 1 month and 3 months respectively. Moreover, the stock is trading above the average of 52-week high price of CAD 2.97 and 52-week low price of CAD 2.35 providing an opportunity to ride the trend.
3.3 One-Year Technical Price Chart
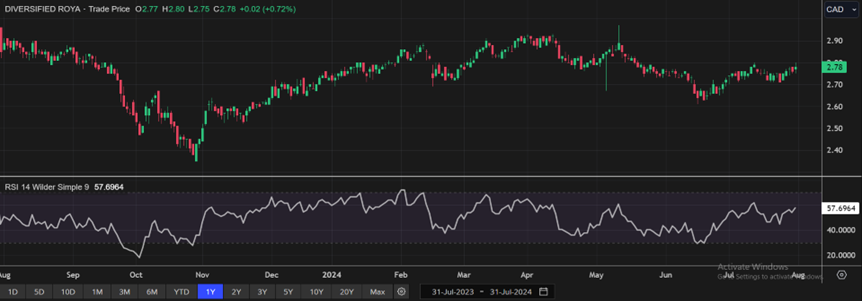
One-Year Technical Price Chart (as of July 31, 2024). Source: REFINITIV, Analysis: Kalkine Group
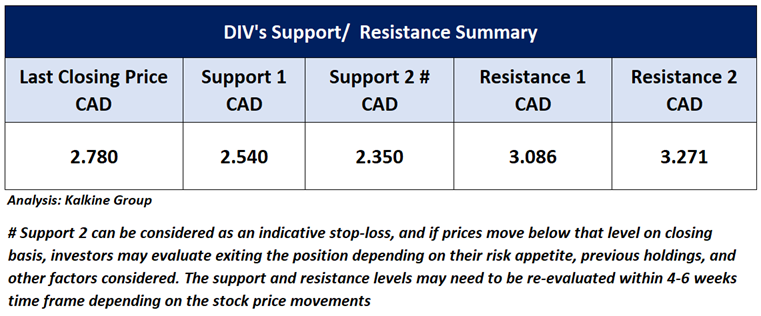
3.4 Technical Summary
Note 1: Past performance is not a reliable indicator of future performance.
Note 2: The reference date for all price data, currency, technical indicators, support, and resistance levels as on July 31, 2024. The reference data in this report has been partly sourced from REFINITIV.
Note 3: Investment decisions should be made depending on an individual's appetite for upside potential, risks, holding duration, and any previous holdings. An 'Exit' from the stock can be considered if the Target Price mentioned as per the Valuation and or the technical levels provided has been achieved and is subject to the factors discussed above.
Note 4: Dividend Yield may vary as per the stock price movement.
Technical Indicators Defined: -
Support: A level at which the stock prices tend to find support if they are falling, and a downtrend may take a pause backed by demand or buying interest.
Resistance: A level at which the stock prices tend to find resistance when they are rising, and the uptrend may take a pause due to profit booking or selling interest.
Stop-loss: In general, it is a level to protect further losses in case of any unfavourable movement in the stock prices.

 Please wait processing your request...