
Section1: Company Overview
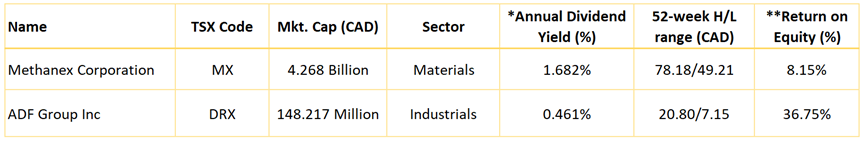
Methanex Corp (TSX: MX) manufactures and sells methanol. Methanex's customers use methanol as a feedstock to produce end-products including adhesives, foams, solvents, and windshield washer fluids. The firm also sells its products to the oil refining industry, where the methanol is blended with gasoline to produce a high-octane fuel or blended as a component of biodiesel. Methanex distributes its products through a global supply chain that includes the operation of port terminals, tankers, barges, rail cars, trucks, and pipelines. China generates the most revenue of any geographical segment. This Report covers the Investment Highlights, Key Financial Metrics, Risks, Technical Analysis along with the Valuation, Target Price, and Recommendation on the stock.
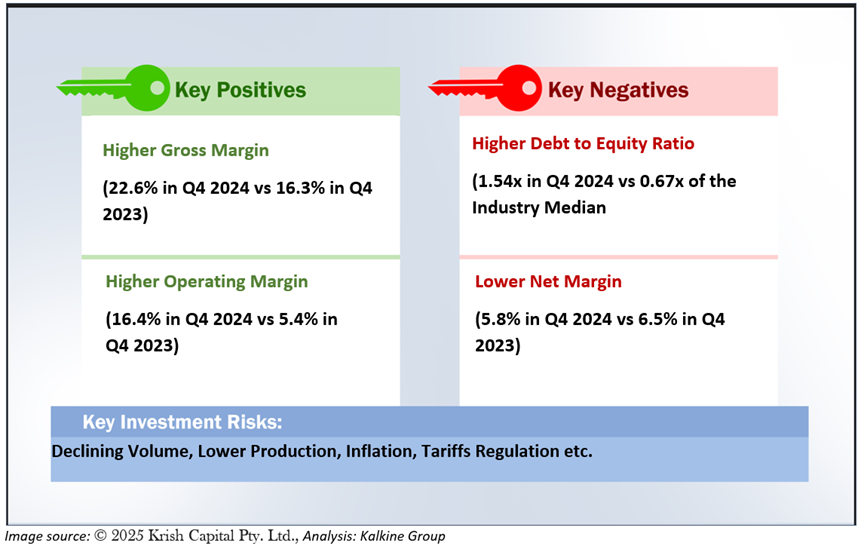
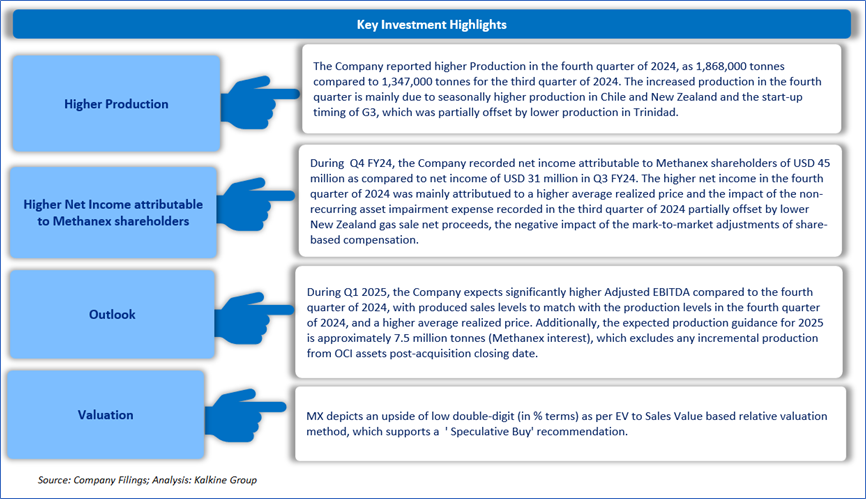
1.1 The Key Positives, Negatives, Investment Highlights, and Risks
Section2: Financial Highlights
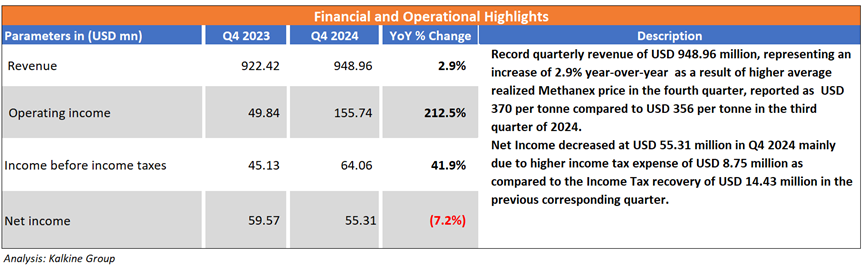
2.1 Key Financial Highlights
Section 3: Stock Recommendation Summary
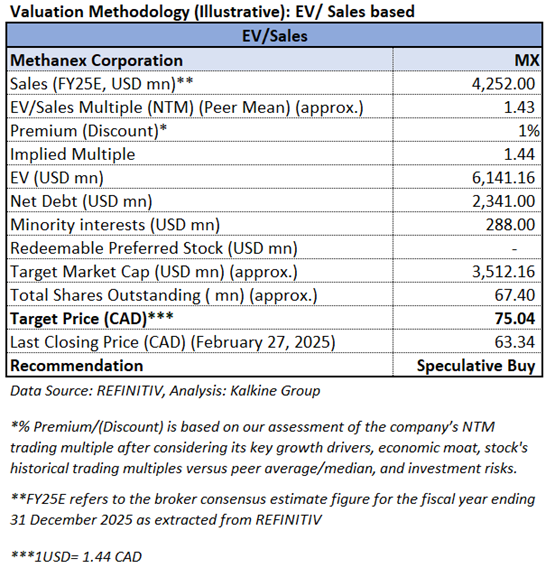
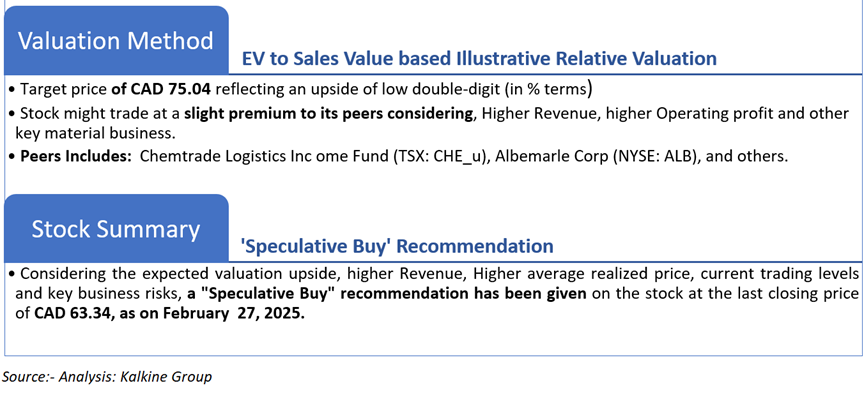
3.1 Valuation Methodology
3.2 Price Performance and Stock Recommendation

The stock has witnessed a downside of ~10.18% over the last 1 month and a downside of ~3.20% over the last 3 months respectively. Moreover, the stock is trading slightly above the average 52-week high price of CAD 78.18 and the 52-week low price of CAD 49.21, providing an opportunity to ride the trend.
3.3 One-Year Technical Price Chart
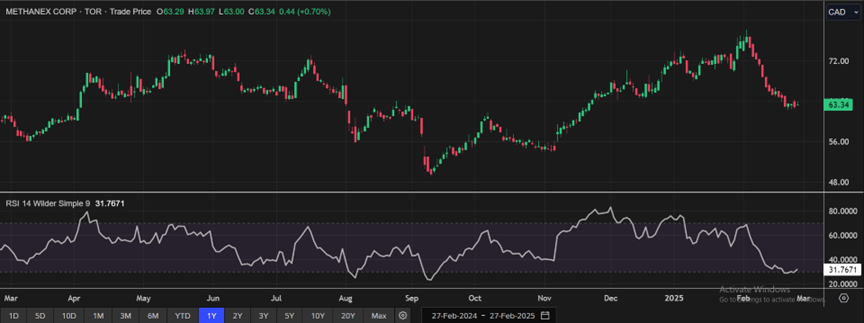
One-Year Technical Price Chart (as of February 27, 2025). Source: REFINITIV, Analysis: Kalkine Group
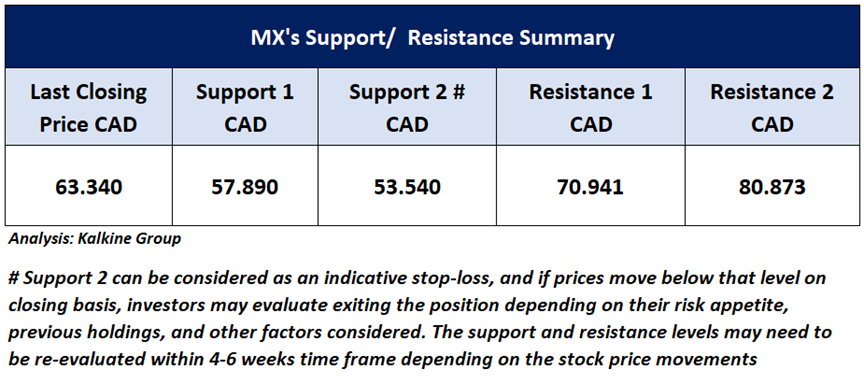
3.4 Technical Summary
Section1: Company Overview
ADF Group Inc (TSX: DRX) involves the design and engineering of connections, fabrication, including industrial coating, and the installation of steel structures and steel built ups, as well as miscellaneous and architectural metalwork. The company's products and services intended for the five principal segments of the non-residential construction industry: Office towers and high-rises, Commercial and recreational buildings, Airport facilities, Industrial complexes, and Transport infrastructures. It serves the client base in the non-residential construction industry, such as general contractors, project owners, engineering firms and project architects, and other steel structure fabricators. This Report covers the Investment Highlights, Key Financial Metrics, Risks, Technical Analysis along with the Valuation, Target Price, and Recommendation on the stock.
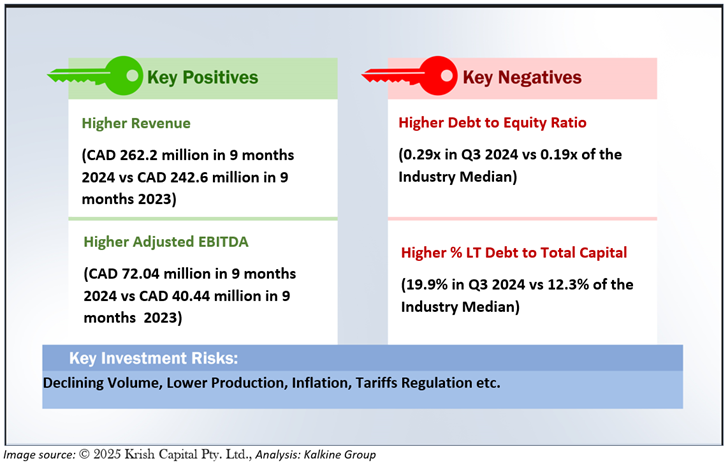
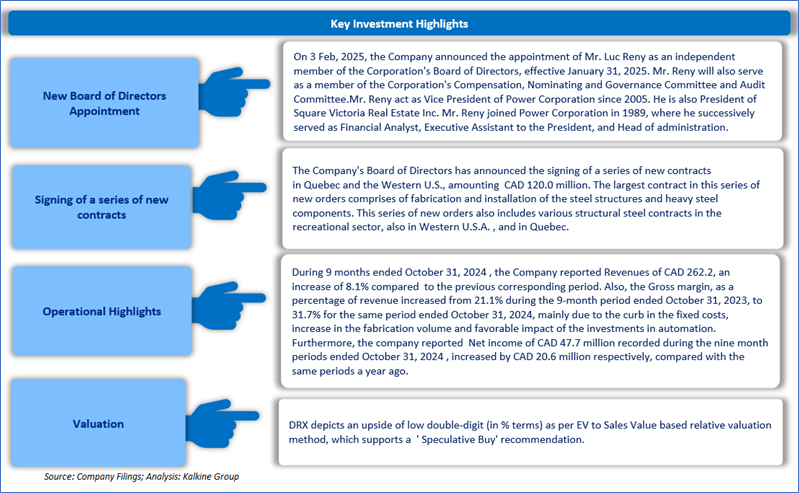
1.2 The Key Positives, Negatives, Investment Highlights, and Risks
Section2: Financial Highlights
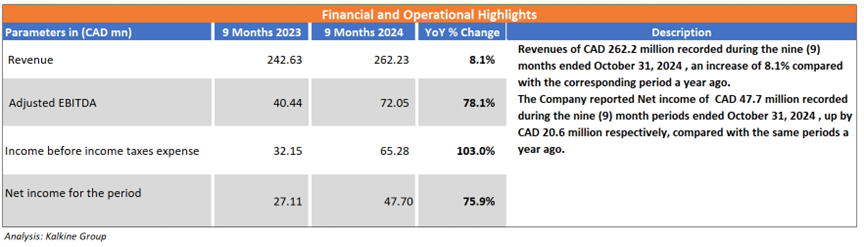
2.1 Key Financial Highlights
Section 3: Stock Recommendation Summary
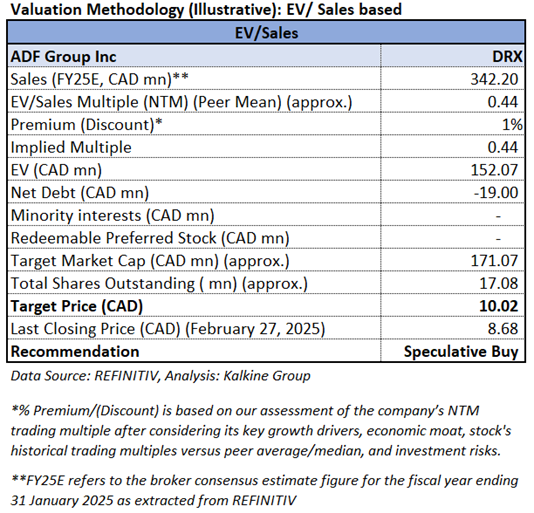
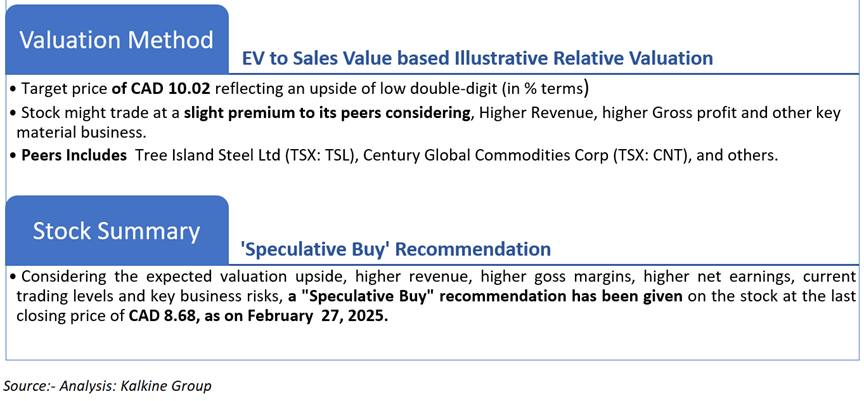
3.1 Valuation Methodology
3.2 Price Performance and Stock Recommendation

The stock has witnessed an upside of ~0.11% over the last 1 month and a downside of ~0.68% over the last 3 months respectively. Moreover, the stock is trading above the average 52-week high price of CAD 20.80 and the 52-week low price of CAD 7.15, providing an opportunity to ride the trend.
3.3 One-Year Technical Price Chart
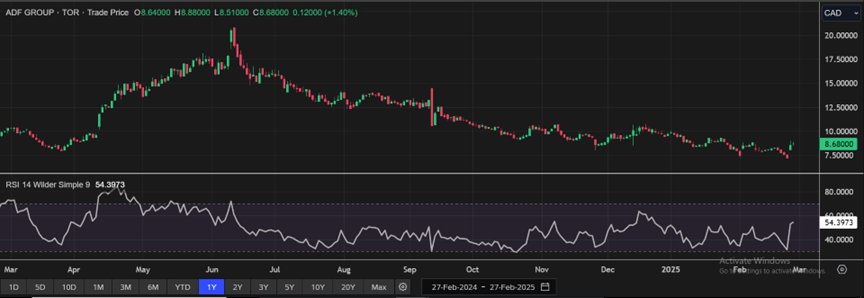
One-Year Technical Price Chart (as of February 27, 2025). Source: REFINITIV, Analysis: Kalkine Group
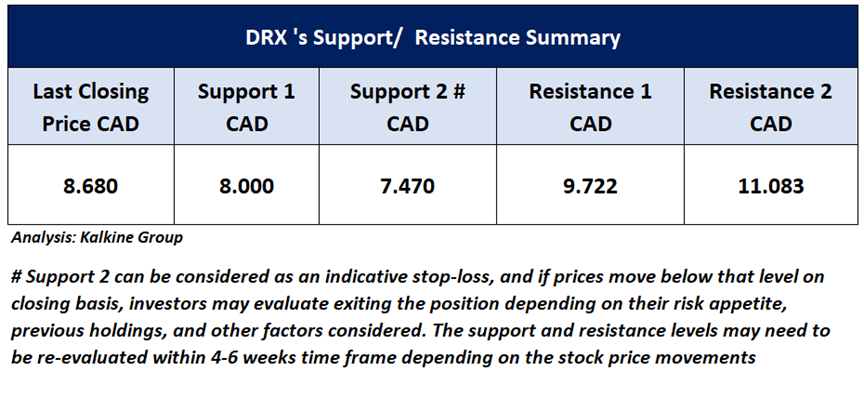
3.4 Technical Summary
Note 1: Past performance is not a reliable indicator of future performance.
Note 2: The reference date for all price data, currency, technical indicators, support, and resistance levels as on February 27, 2025. The reference data in this report has been partly sourced from REFINITIV.
Note 3: Investment decisions should be made depending on an individual's appetite for upside potential, risks, holding duration, and any previous holdings. An 'Exit' from the stock can be considered if the Target Price mentioned as per the Valuation and or the technical levels provided has been achieved and is subject to the factors discussed above.
Note 4: Dividend Yield may vary as per the stock price movement.
Note 5: Kalkine reports are prepared based on the stock prices captured either from REFINITIV or Trading View. Typically, REFINITIV or Trading View may reflect stock prices with a delay which could be a lag of 25-30 minutes. There can be no assurance that future results or events will be consistent with the information provided in the report. The information is subject to change without any prior notice.’
Technical Indicators Defined: -
Support: A level at which the stock prices tend to find support if they are falling, and a downtrend may take a pause backed by demand or buying interest.
Resistance: A level at which the stock prices tend to find resistance when they are rising, and the uptrend may take a pause due to profit booking or selling interest.
Stop-loss: In general, it is a level to protect further losses in case of any unfavourable movement in the stock prices.

 Please wait processing your request...