Section1: Company Overview

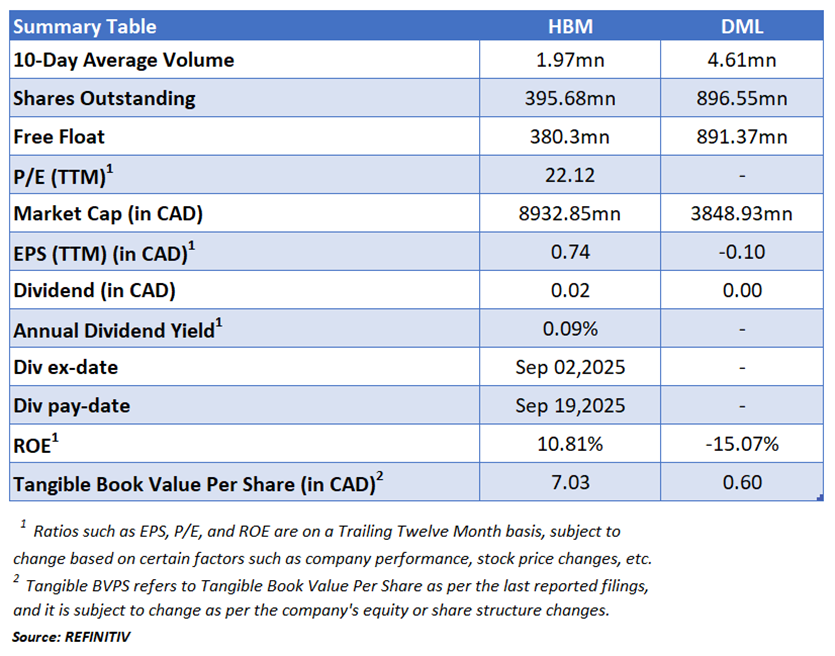
Hudbay Minerals Inc. (TSX: HBM) is a Canadian mining company with its operations, property developments, and exploration activities across the United States. The major mines that Hudbay operates are located in Manitoba, Canada, Arizona, United States; and Peru. The company is principally focused on the discovery, production, and marketing of base and precious metals.
This Report covers the Investment Highlights, Key Financial Metrics, Risks, Technical Analysis along with the Valuation, Target Price, and Recommendation on the stock.

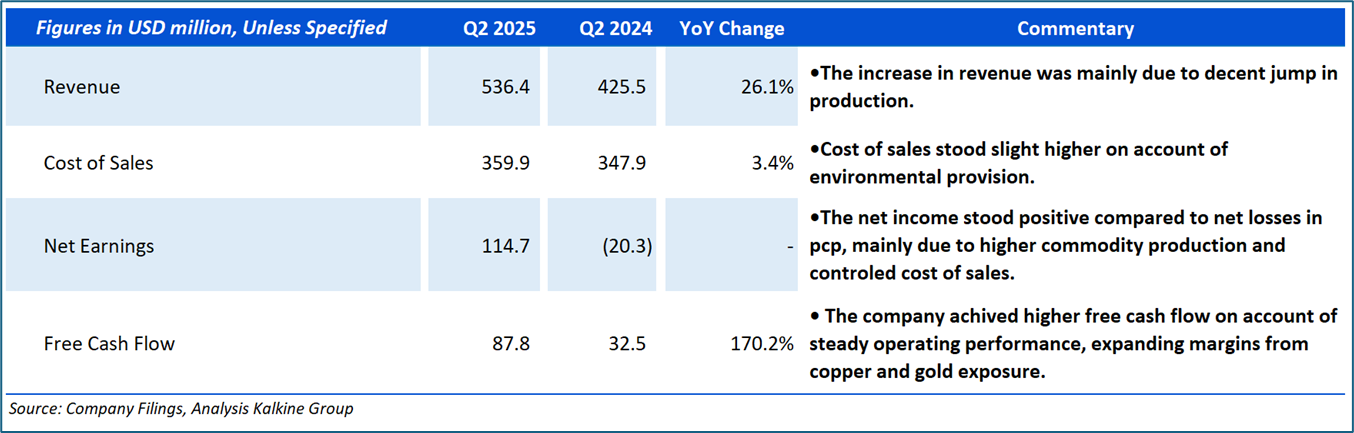
Section2: Financial Highlights

Section 3: Stock Recommendation Summary

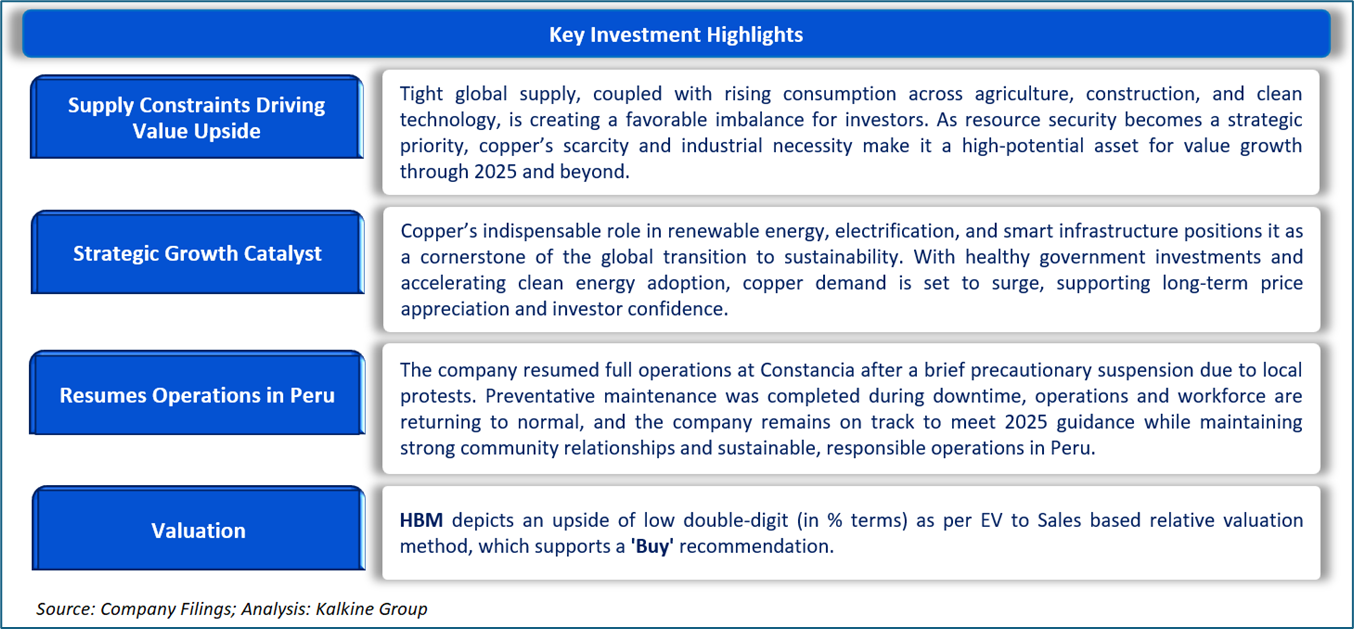
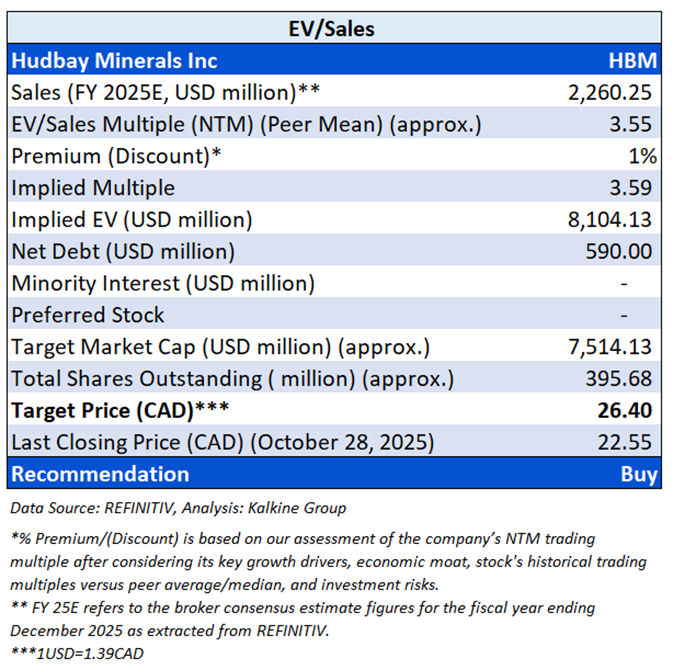
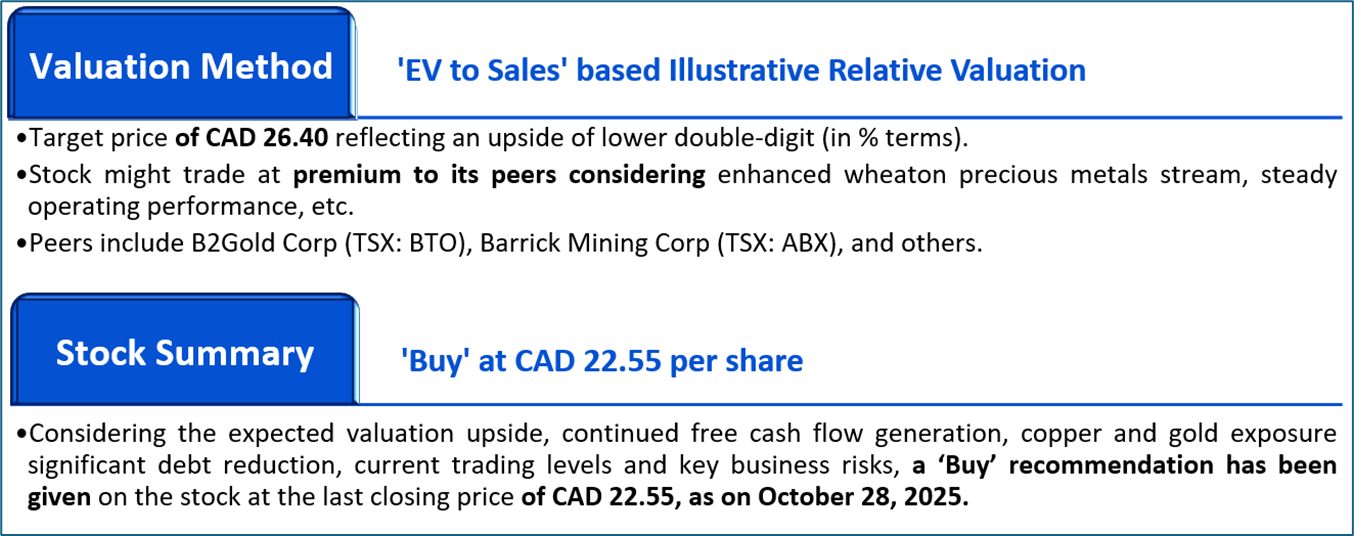
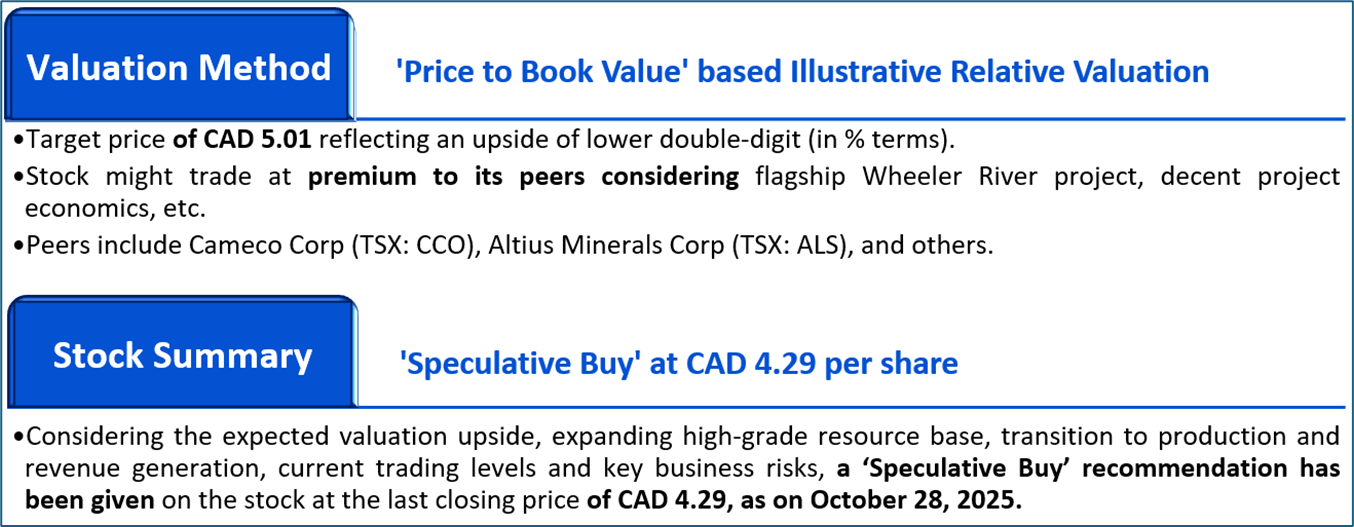
Valuation Methodology: EV to Sales value Multiple Based Relative Valuation (Illustrative):


The stock has witnessed an upside of ~5.67% and ~14.23% over the last 1 week and 1 month respectively. Moreover, it is trading above the average 52-week high price of CAD 24.745 and 52-week low price of CAD 8.49, providing an opportunity to ride the trend.

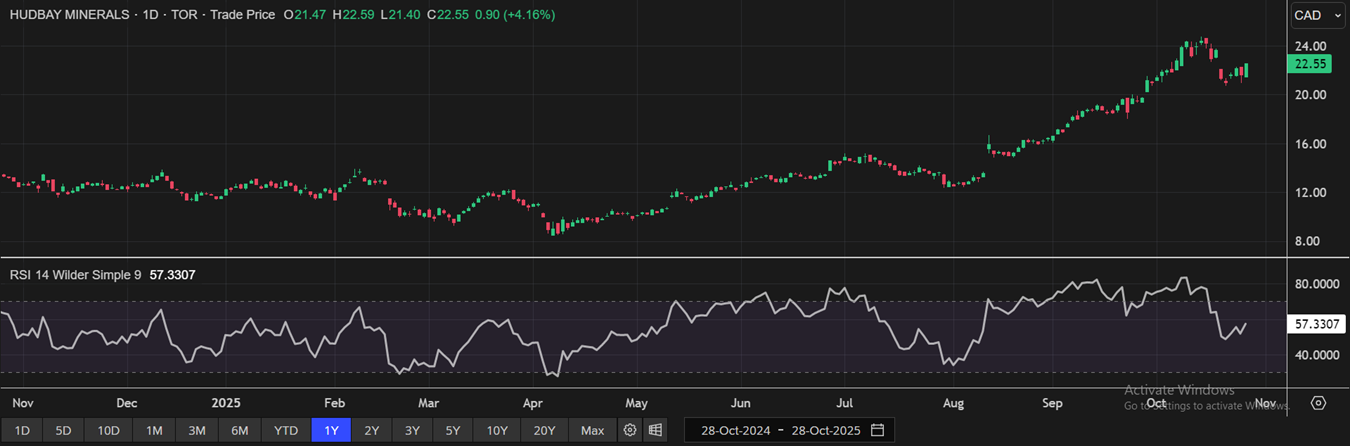
One-Year Technical Price Chart (as of October 28, 2025). Source: REFINITIV, Analysis: Kalkine Group

Section1: Company Overview

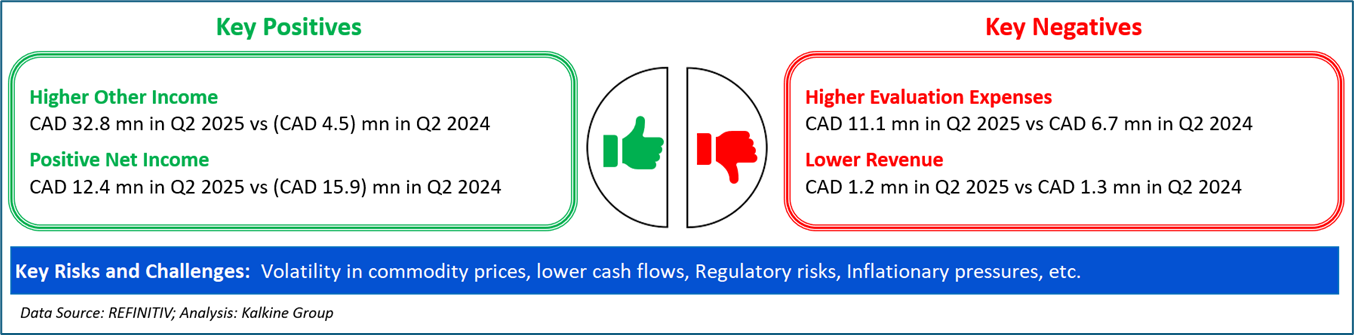
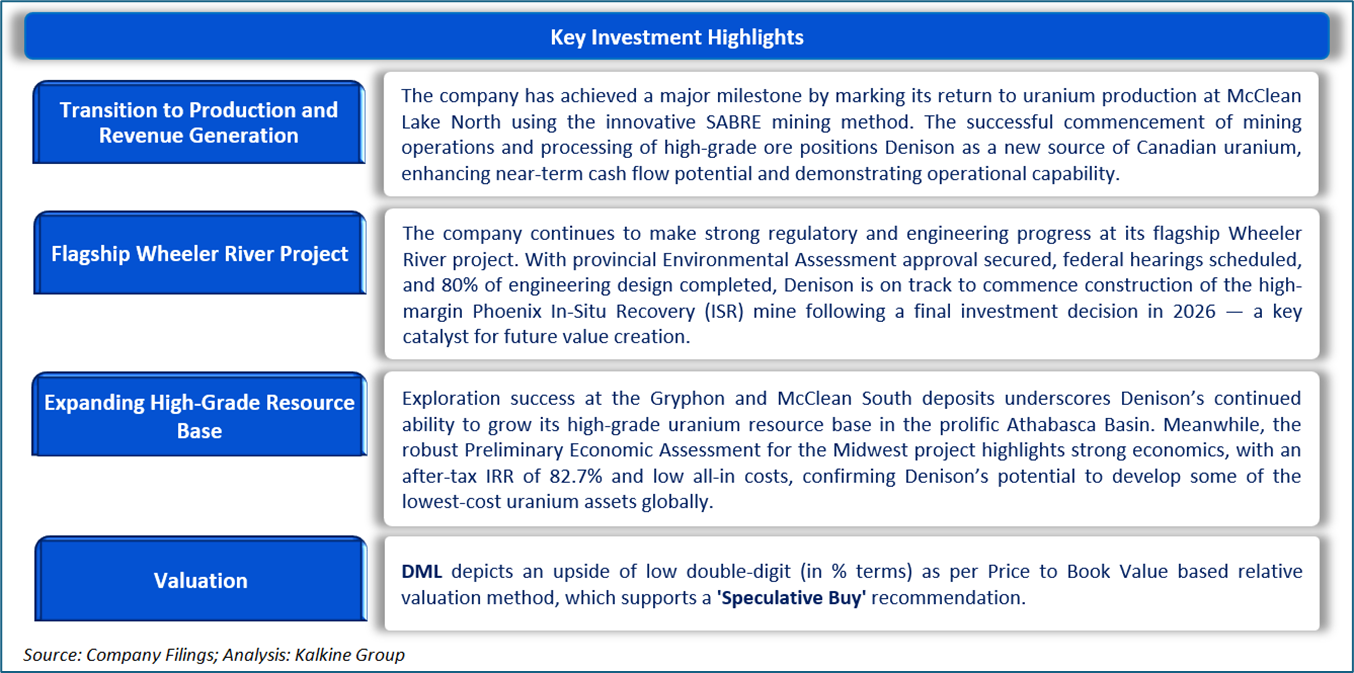
Denison Mines Corp. (TSX: DML) is a uranium exploration and development company with interests focused in the Athabasca Basin region of northern Saskatchewan, Canada. The company has an effective 95% interest in its flagship Wheeler River Uranium Project, which is the largest undeveloped uranium project in the infrastructure rich eastern portion of the Athabasca Basin region of northern Saskatchewan.
This Report covers the Investment Highlights, Key Financial Metrics, Risks, Technical Analysis along with the Valuation, Target Price, and Recommendation on the stock.

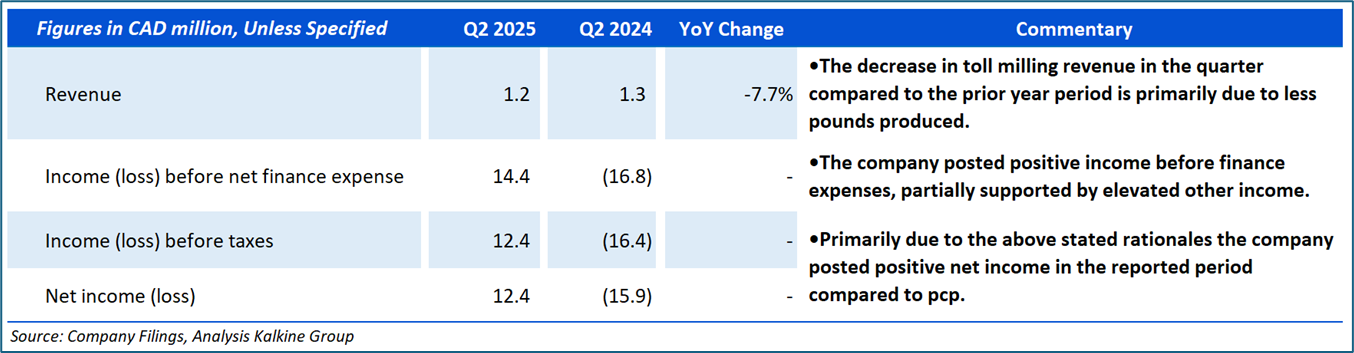
Section2: Financial Highlights

Section 3: Stock Recommendation Summary

Valuation Methodology: Price to Book Value Multiple Based Relative Valuation (Illustrative):
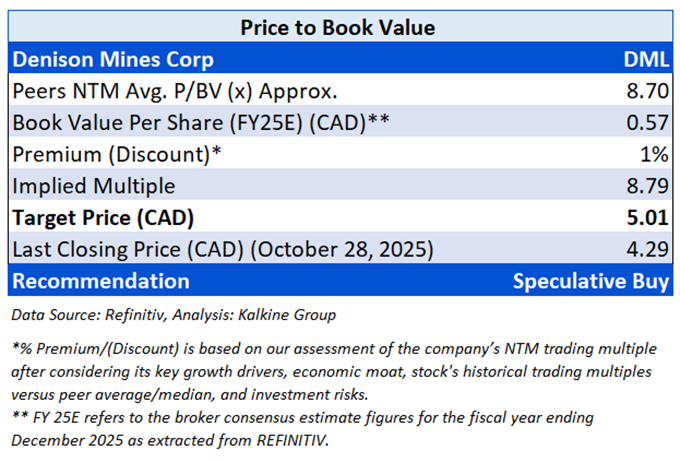


The stock has witnessed an upside of ~12.30% and ~10.85% over the last 1 week and 1 month respectively. Moreover, it is trading above the average 52-week high price of CAD 4.79 and 52-week low price of CAD 1.58, providing an opportunity to ride the trend.

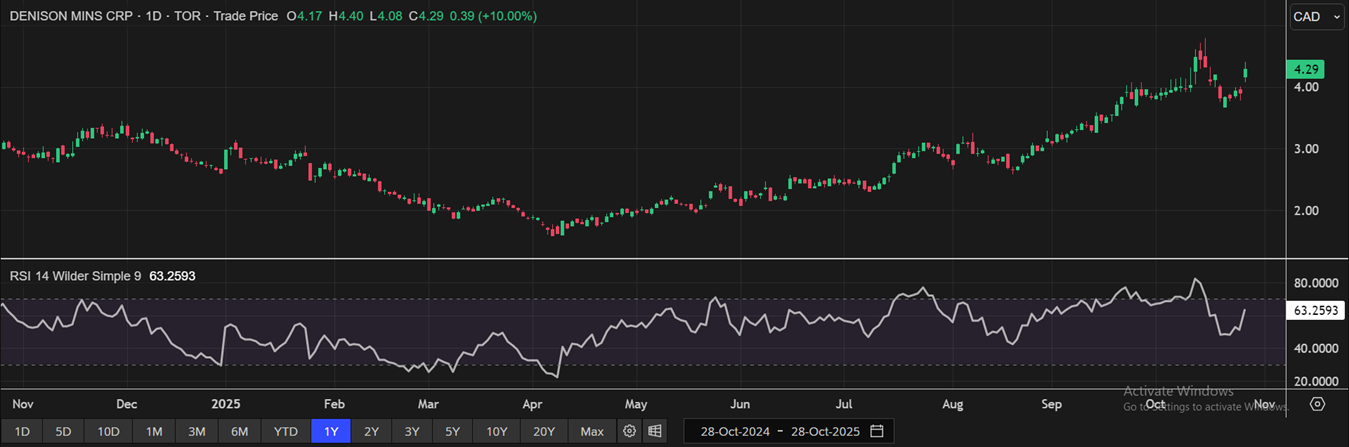
One-Year Technical Price Chart (as of October 28, 2025). Source: REFINITIV, Analysis: Kalkine Group

Note 1: Past performance is not a reliable indicator of future performance.
Note 2: The reference date for all price data, currency, technical indicators, support, and resistance levels as on October 28, 2025. The reference data in this report has been partly sourced from REFINITIV.
Note 3: Investment decisions should be made depending on an individual's appetite for upside potential, risks, holding duration, and any previous holdings. An 'Exit' from the stock can be considered if the Target Price mentioned as per the Valuation and or the technical levels provided has been achieved and is subject to the factors discussed above.
Note 4: Dividend Yield may vary as per the stock price movement.
Note 5: Kalkine reports are prepared based on the stock prices captured either from REFINITIV or Trading View. Typically, REFINITIV or Trading View may reflect stock prices with a delay which could be a lag of 25-30 minutes. There can be no assurance that future results or events will be consistent with the information provided in the report. The information is subject to change without any prior notice.
Technical Indicators Defined: -
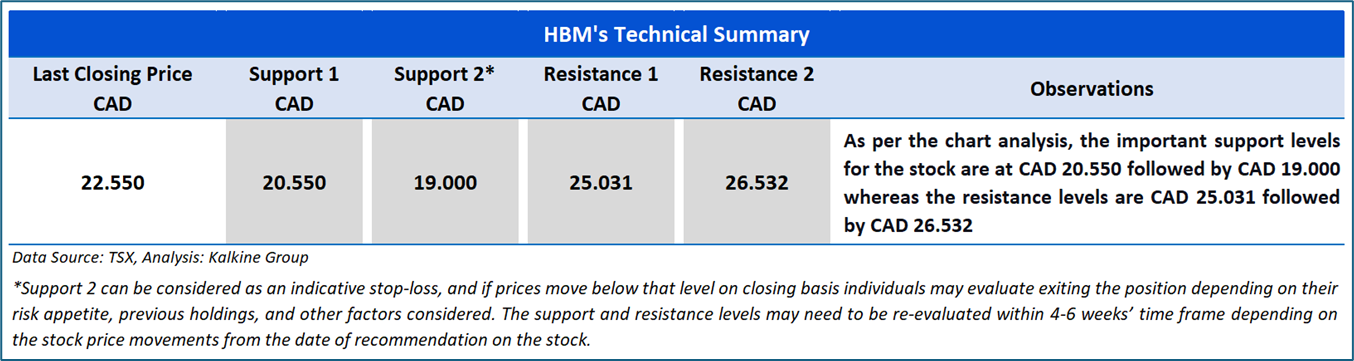
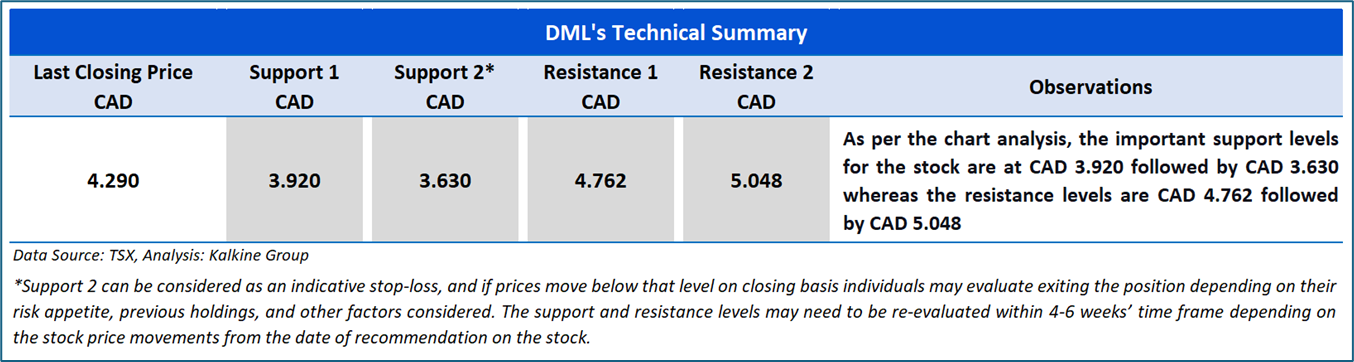
Support: A level at which the stock prices tend to find support if they are falling, and a downtrend may take a pause backed by demand or buying interest.
Resistance: A level at which the stock prices tend to find resistance when they are rising, and the uptrend may take a pause due to profit booking or selling interest.
Stop-loss: In general, it is a level to protect further losses in case of any unfavourable movement in the stock prices.
 Please wait processing your request...