Section1: Company Overview

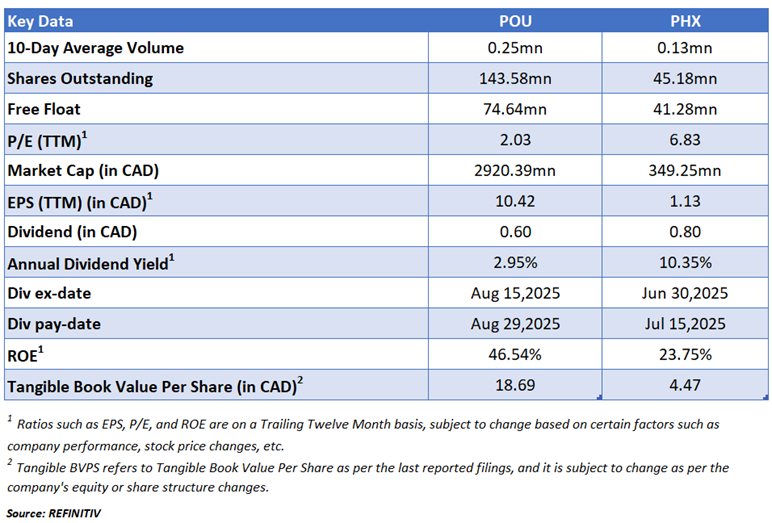
Paramount Resources Ltd (TSX: POU) is a Canadian energy company that explores, develops, produces, and markets natural gas, crude oil, and natural gas liquids. The company takes part in exploration and production in Alberta and British Columbia. Sales for Paramount's products are priced in a multitude of markets that span the United States and Canada. Depending on the product, contracts can have daily, monthly, or long-term agreements. Assets for exploration and production are acquired by way of royalties that are paid to provincial governments and freehold landowners.
This Report covers the Investment Highlights, Key Financial Metrics, Risks, Technical Analysis along with the Valuation, Target Price, and Recommendation on the stock.

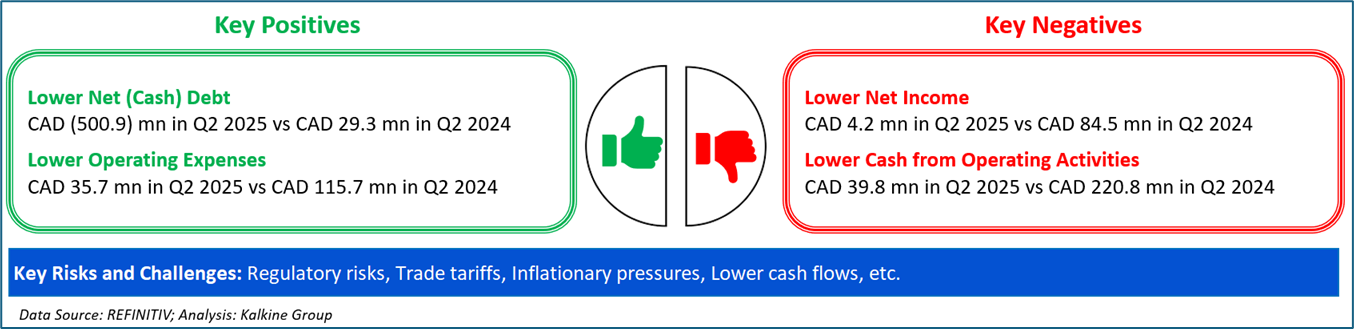
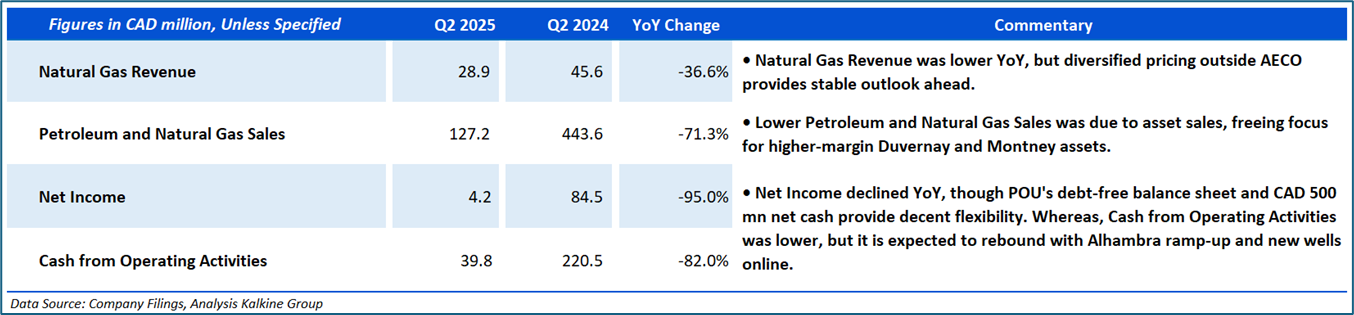
Section2: Financial Highlights

Section 3: Stock Recommendation Summary

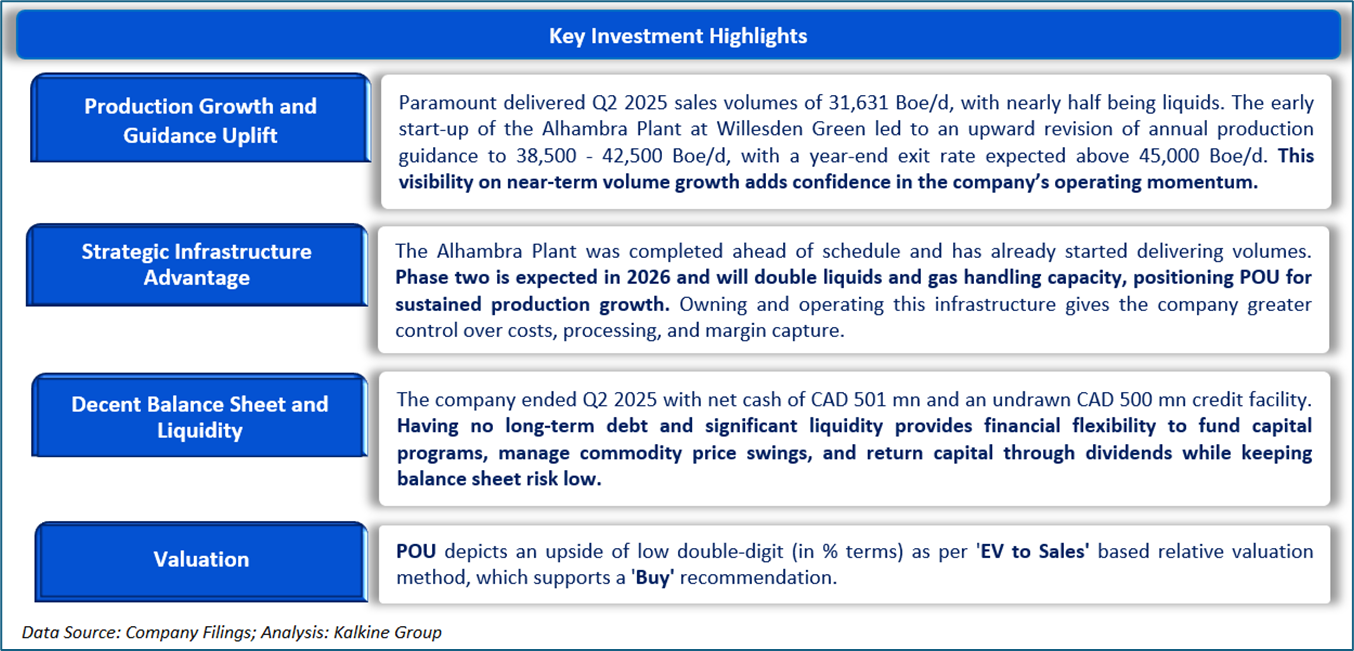
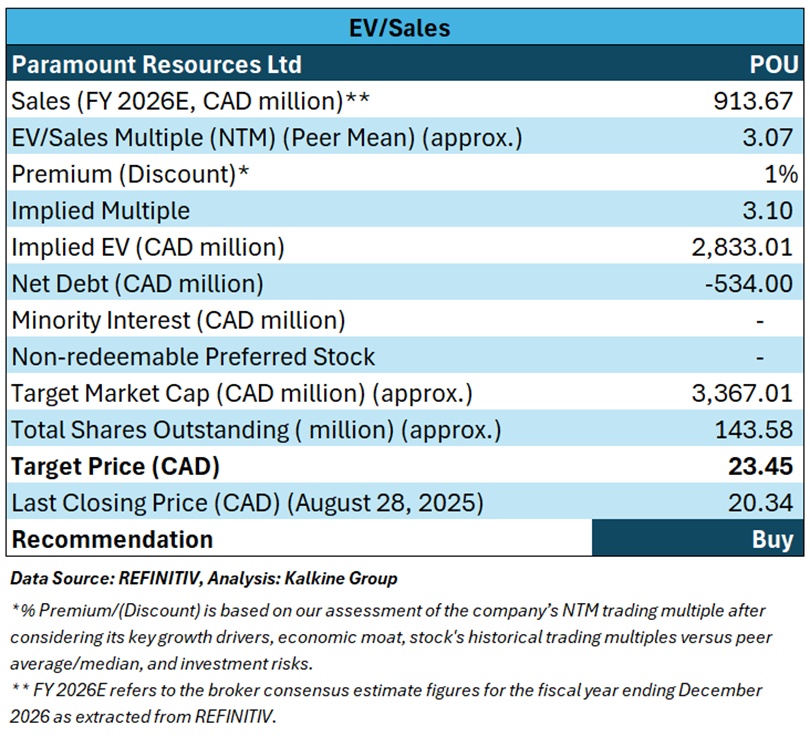
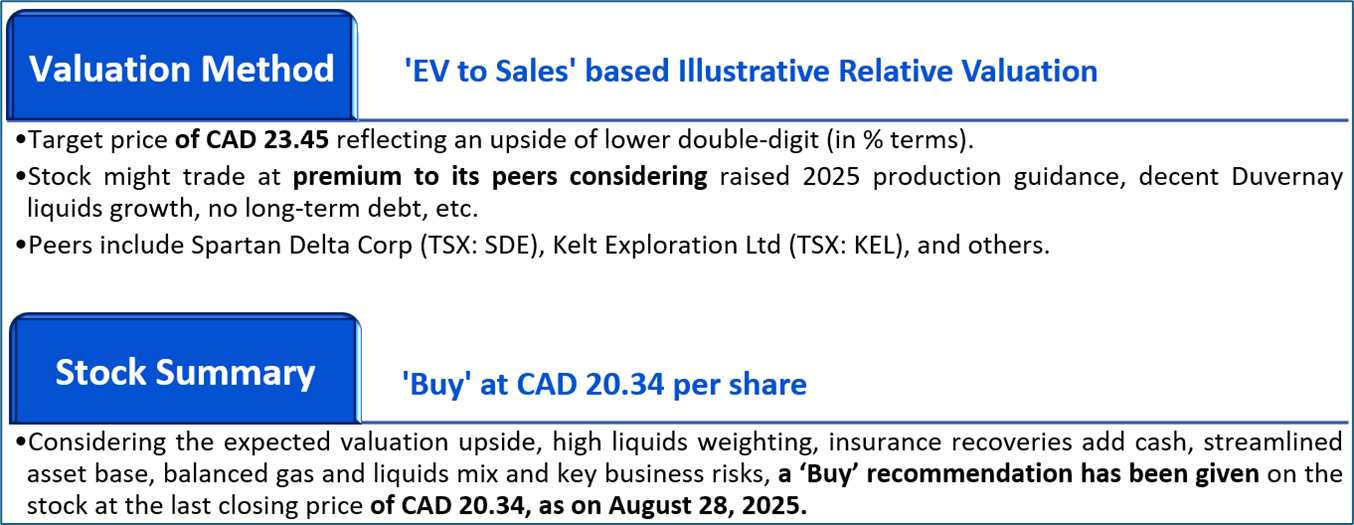
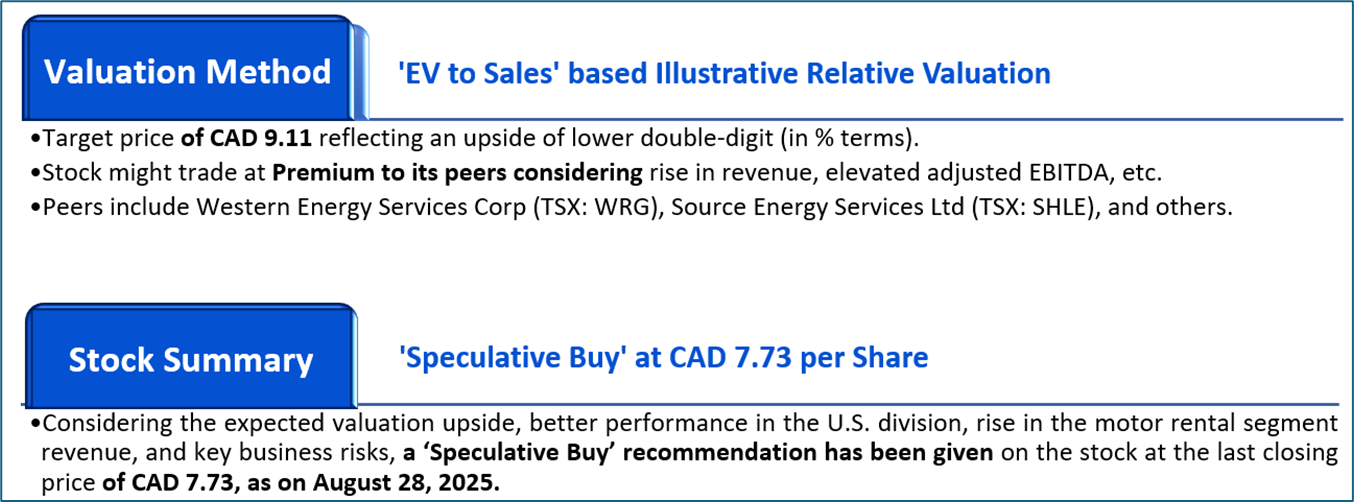
Valuation Methodology: EV to Sales value Multiple Based Relative Valuation (Illustrative):


The stock has witnessed an upside of ~2.46% and ~5.60% over the last 1 week and 3 months respectively. Moreover, it is trading below the average 52-week high price of CAD 32.82 and 52-week low price of CAD 14.33, providing an opportunity to accumulate the stock.

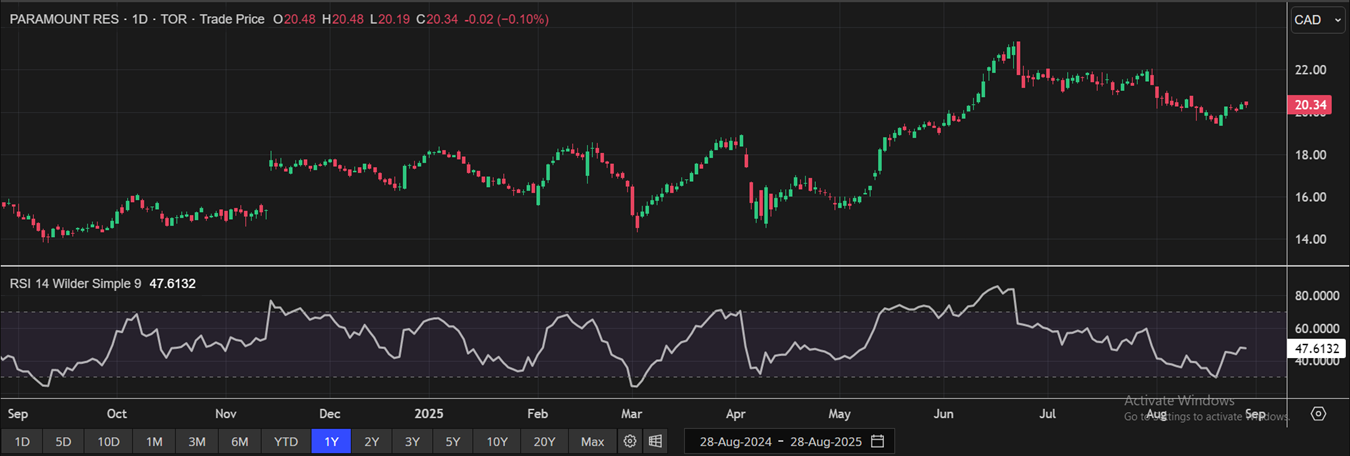
One-Year Technical Price Chart (as of August 28, 2025). Source: REFINITIV, Analysis: Kalkine Group

Section1: Company Overview

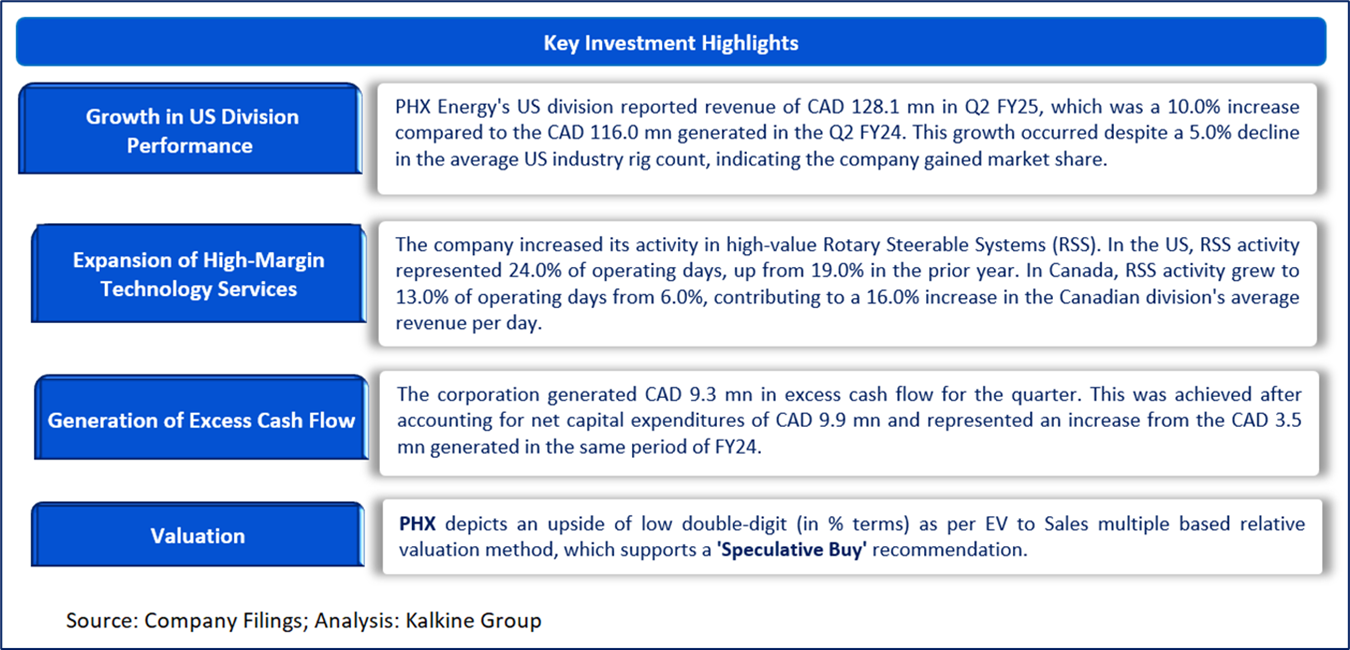
PHX Energy Services Corp. (TSX: PHX) is a Canadian service provider company. It is principally engaged in providing horizontal and directional drilling services, as well as web-based remote electronic drilling recorder technology and services, to oil and natural gas exploration and development companies in Canada, United States, Albania, and Russia. The services provided by the company include directional drilling and motor rentals, survey management, gyro surveying and stream services. Geographically, the company operates in Canada, United States, and International. The majority of the company's revenue comes from the United States.
This Report covers the Investment Highlights, Key Financial Metrics, Risks, Technical Analysis along with the Valuation, Target Price, and Recommendation on the stock.

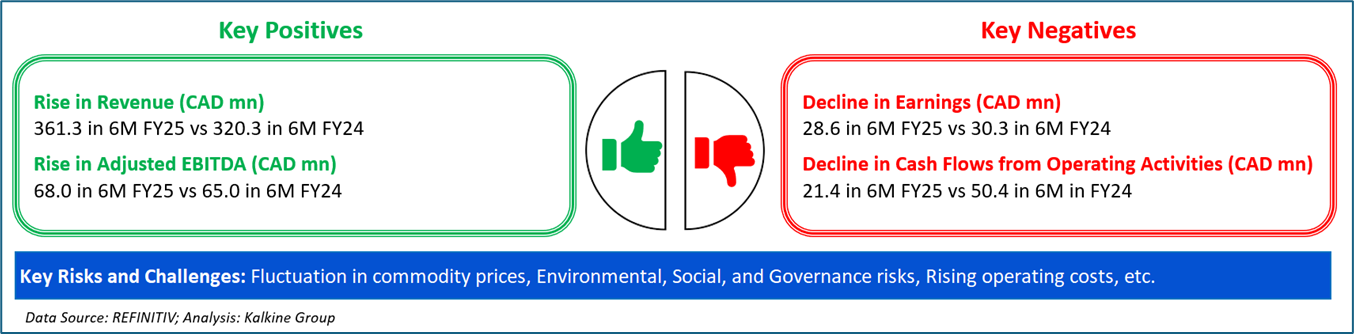
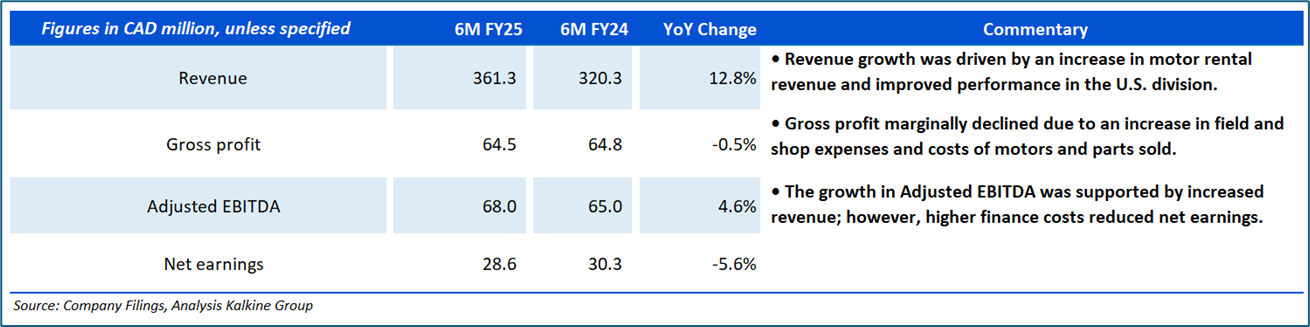
Section2: Financial Highlights – 6M FY25

Section 3: Stock Recommendation Summary

Valuation Methodology: EV/Sales Multiple Based Relative Valuation (Illustrative):
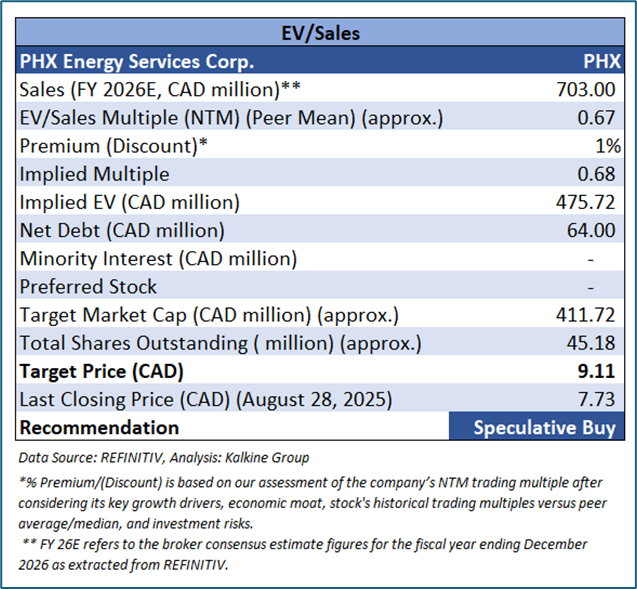


The stock has witnessed an upside of ~2.38% and a downside of ~4.33% over the 1 week and 3 months respectively. It is trading below the average of 52-week high price of CAD 10.28 and 52-week low price of CAD 6.64, providing an opportunity to accumulate the stock.

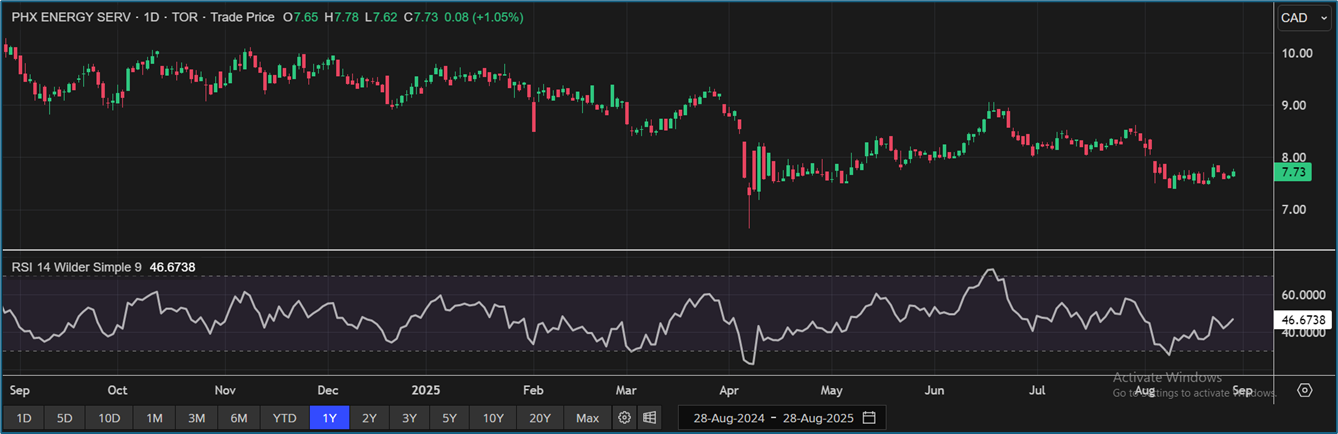
One-Year Technical Price Chart (as of August 28, 2025). Source: REFINITIV, Analysis: Kalkine Group

Note 1: Past performance is not a reliable indicator of future performance.
Note 2: The reference date for all price data, currency, technical indicators, support, and resistance levels as on August 28, 2025. The reference data in this report has been partly sourced from REFINITIV.
Note 3: Investment decisions should be made depending on an individual's appetite for upside potential, risks, holding duration, and any previous holdings. An 'Exit' from the stock can be considered if the Target Price mentioned as per the Valuation and or the technical levels provided has been achieved and is subject to the factors discussed above.
Note 4: Dividend Yield may vary as per the stock price movement.
Note 5: Kalkine reports are prepared based on the stock prices captured either from REFINITIV or Trading View. Typically, REFINITIV or Trading View may reflect stock prices with a delay which could be a lag of 25-30 minutes. There can be no assurance that future results or events will be consistent with the information provided in the report. The information is subject to change without any prior notice.
Technical Indicators Defined: -
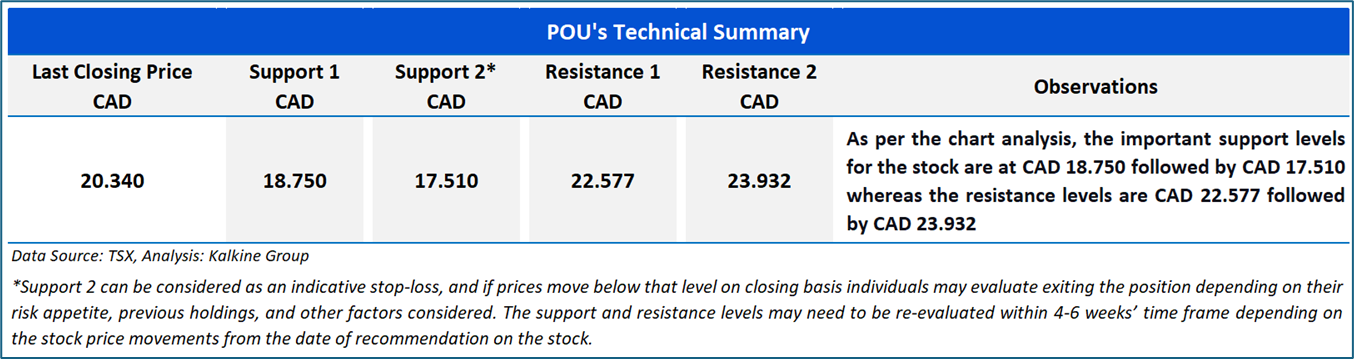
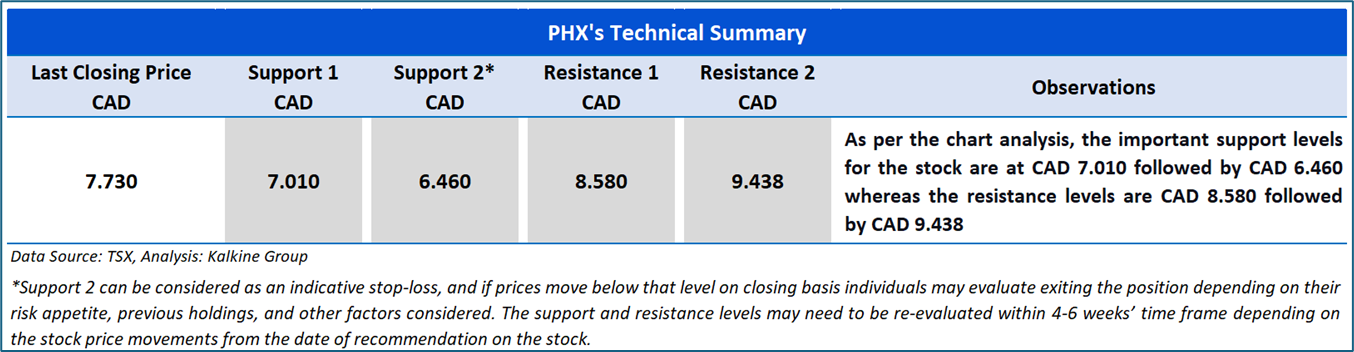
Support: A level at which the stock prices tend to find support if they are falling, and a downtrend may take a pause backed by demand or buying interest.
Resistance: A level at which the stock prices tend to find resistance when they are rising, and the uptrend may take a pause due to profit booking or selling interest.
Stop-loss: In general, it is a level to protect further losses in case of any unfavourable movement in the stock prices.

 Please wait processing your request...