Palantir Technologies Inc
Palantir Technologies Inc. (NYSE: PLTR) is engaged in building software to assist in counterterrorism investigations and operations. It has built four principal software platforms, including Palantir Gotham (Gotham), Palantir Foundry (Foundry), Palantir Apollo (Apollo), and Palantir Artificial Intelligence Platform (AIP). Apollo is a cloud-agnostic, single control layer that coordinates ongoing delivery of new features, security updates, and platform configurations, helping to ensure the continuous operation of critical systems.
Key Business & Financial Updates
Second Quarter 2024 Financial Results
- Revenue Growth: The company's total revenue reached USD 678 million in the second quarter, representing a 27% year-over-year increase and a 7% quarter-over-quarter growth. This significant revenue increase was driven by both commercial and government segments.
- US Commercial Highlights: Palantir's US commercial segment demonstrated robust growth, with revenue rising by 55% year-over-year and 6% quarter-over-quarter to reach USD 159 million. The company’s US commercial customer base also expanded, growing by 83% year-over-year and 13% quarter-over-quarter, resulting in 295 total customers. The remaining deal value (RDV) in the US commercial segment grew by an impressive 103% year-over-year and 11% quarter-over-quarter.
- US Government Revenue and Global Commercial Performance: US government revenue increased by 24% year-over-year and 8% quarter-over-quarter, reaching USD 278 million. Globally, commercial revenue grew by 33% year-over-year and 3% quarter-over-quarter to USD 307 million, while government revenue rose by 23% year-over-year and 11% quarter-over-quarter, amounting to USD 371 million.
- Key Metrics and Deal Activity: The company closed 27 deals, each valued at over USD 10 million, further solidifying its financial strength. Palantir’s customer count grew by 41% year-over-year and 7% quarter-over-quarter. On a GAAP basis, net income stood at USD 134 million, representing a 20% margin. The company achieved GAAP income from operations of USD 105 million, reflecting a 16% margin. Adjusted income from operations was reported at USD 254 million, representing a margin of 37%.
- Profitability and Cash Flow: Palantir's Rule of 40 score reached 64%. GAAP earnings per share (EPS) increased by 500% year-over-year to USD 0.06, while adjusted EPS grew by 80% year-over-year to USD 0.09. The company had USD 4.0 billion in cash, cash equivalents, and short-term US treasury securities. Cash from operations amounted to USD 144 million, representing a 21% margin, while adjusted free cash flow stood at USD 149 million, with a margin of 22%.
Outlook for Q3 2024 and Full-Year 2024 Guidance:
- Q3 2024 Expectations: Palantir anticipates revenue between USD 697 million and USD 701 million for the third quarter of 2024. The company also expects adjusted income from operations to be in the range of USD 233 million to USD 237 million.
- Full-Year 2024 Guidance: For the full year 2024, Palantir has raised its revenue guidance to between USD 2.742 billion and USD 2.750 billion. The company also expects US commercial revenue to exceed USD 672 million, representing a growth rate of at least 47%. Adjusted income from operations is projected to range between USD 966 million and USD 974 million. Additionally, Palantir continues to forecast adjusted free cash flow of between USD 800 million and USD 1 billion and expects GAAP operating income and net income in each quarter of 2024.
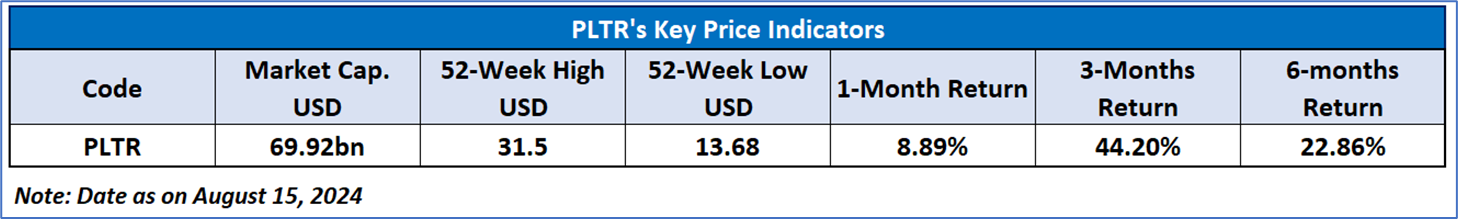
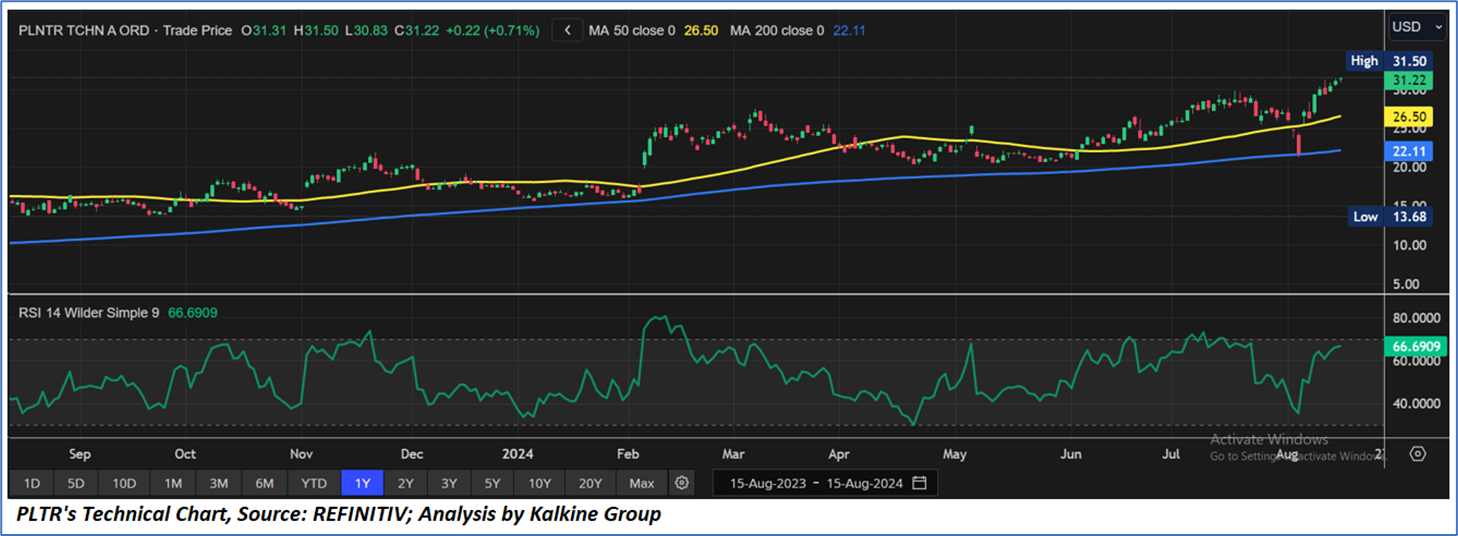
Technical Observation (on the daily chart):
The Relative Strength Index (RSI) over a 14-day period stands at a value of 66.69, upward trending and nearing overbought zone, with the price taking reversal from an important support zone of USD 22.00-USD 24.00. Additionally, the stock's current positioning is above both 50-Day SMA and 200-Day SMA, which can act as a short to medium term support levels.
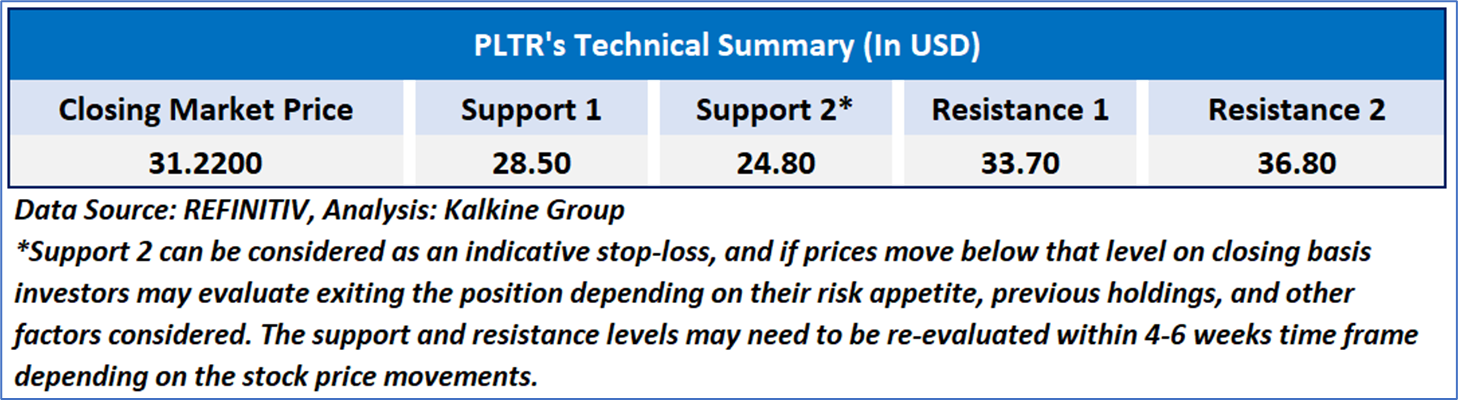
Individuals can evaluate the stock based on the support and resistance levels provided in the report in case of keen interest taking into consideration the risk-reward scenario.
Markets are trading in a highly volatile zone currently due to certain macro-economic issues and prevailing geopolitical tensions. Therefore, it is prudent to follow a cautious approach while investing.
Related Risk: This report may be looked at from a high-risk perspective and a recommendation is provided for a short duration. This report is solely based on technical parameters, and the fundamental performance of the stocks has not been considered in the decision-making process. Other factors which could impact the stock prices include market risks, regulatory risks, interest rates risks, currency risks, social and political instability risks etc.
Note 1: Past performance is not a reliable indicator of future performance.
Note 2: The reference date for all price data, currency, technical indicators, support, and resistance level is August 15, 2024. The reference data in this report has been partly sourced from REFINITIV.
Note 3: Investment decisions should be made depending on an individual's appetite for upside potential, risks, holding duration, and any previous holdings. An 'Exit' from the stock can be considered if the Target Price mentioned as per the Valuation and or the technical levels provided has been achieved and is subject to the factors discussed above.
Note 4: Target Price refers to a price level that the stock is expected to reach as per the relative valuation method and or technical analysis taking into consideration both short-term and long-term scenarios.
Note 5: ‘Kalkine reports are prepared based on the stock prices captured either from the New York Stock Exchange (NYSE), NASDAQ Capital Markets (NASDAQ), and or REFINITIV. Typically, all sources (NYSE, NASDAQ, or REFINITIV) may reflect stock prices with a delay which could be a lag of 15-20 minutes. There can be no assurance that future results or events will be consistent with the information provided in the report. The information is subject to change without any prior notice.

 Please wait processing your request...