Sify Technologies Ltd
Sify Technologies Ltd. (NASDAQ: SIFY) engages in the provision of integrated Internet, network, and electronic commerce services in India. It operates through the following segments: Network-centric Services, and Data Center-centric Information Technology Services. The Network-centric Services segment includes domestic data, international data wholesale voice, and network managed services. The Data Center-centric Information Technology Services segment comprises of data center; cloud and managed; technology integration, and applications integration services.
Key Business and Financial Updates:
- Financial Performance and Upcoming Results Announcement: Sify Technologies Limited (NASDAQ: SIFY), India’s leading digital ICT solutions provider, announced that it will release its unaudited financial results for Q2 FY2025–26 on October 25, 2025, before market hours. The announcement will be followed by a conference call on October 27, 2025, featuring Chairman Mr. Raju Vegesna and Group CFO Mr. M. P. Vijay Kumar. The company’s most recent quarterly performance (Q1 FY2025–26) demonstrated a 14% year-over-year revenue growth to INR 10,723 million and an EBITDA increase of 18% to INR 2,111 million, though it reported a net loss of INR 389 million primarily due to higher depreciation and interest costs associated with ongoing infrastructure investments.
- Operational Efficiency and Strategic Investments: Sify continues to strengthen its operational base through strategic capital expenditure and service diversification. During Q1 FY2025–26, the company commissioned 8.6 MW of additional data center capacity, enhancing its service footprint across 1,159 fiber nodes and 9,661 SD-WAN points, marking a 10% increase over the previous year. The revenue mix was well-diversified across its key segments — Network Services (41%), Data Center Services (37%), and Digital Services (22%). The continued investment in high-growth digital infrastructure and network expansion underscores Sify’s focus on scalability and efficiency, positioning it favorably amid India’s accelerating demand for cloud and digital connectivity solutions.
- Leadership Commentary and Strategic Vision: Chairman Mr. Raju Vegesna emphasized India’s transformative role in the global digital landscape, asserting that the coming decade will see India emerge as a hub for digital infrastructure, AI innovation, and automation. He credited national initiatives such as Digital India and the India AI Mission for driving large-scale investments in compute infrastructure and connectivity. CFO Mr. M. P. Vijay Kumar reinforced Sify’s commitment to fiscal prudence and sustainability, noting that the company’s disciplined financial approach — despite short-term losses — is focused on long-term value creation, risk management, and building future-ready digital capabilities.
- Segment Performance and Financial Position: Sify’s Network and Data Center segments continued to perform strongly, with revenue from Data Center Services rising to INR 3,961 million and Network Services contributing INR 4,379 million. However, the Digital Services segment reported a minor operational loss due to upfront investments in cloud and security solutions. The company’s net debt increased to INR 30,321 million, reflecting ongoing expansion efforts, while the cash balance stood at INR 3,861 million. Despite near-term margin pressures, Sify’s sustained infrastructure investments, strong enterprise partnerships, and expanding service base reinforce its trajectory toward long-term growth and leadership in India’s digital ecosystem.
Technical Observation (on the daily chart):
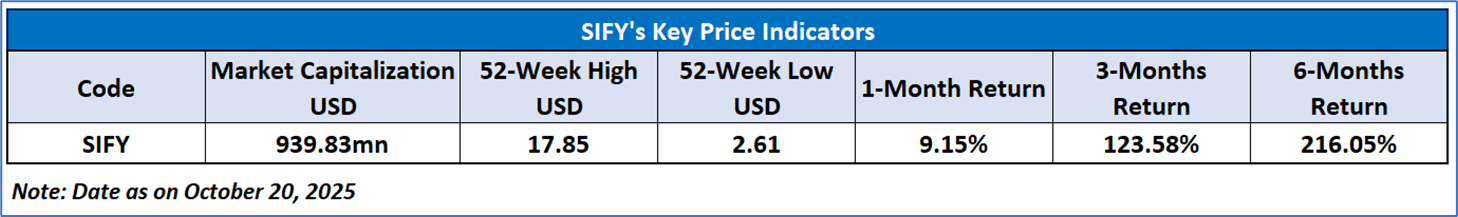
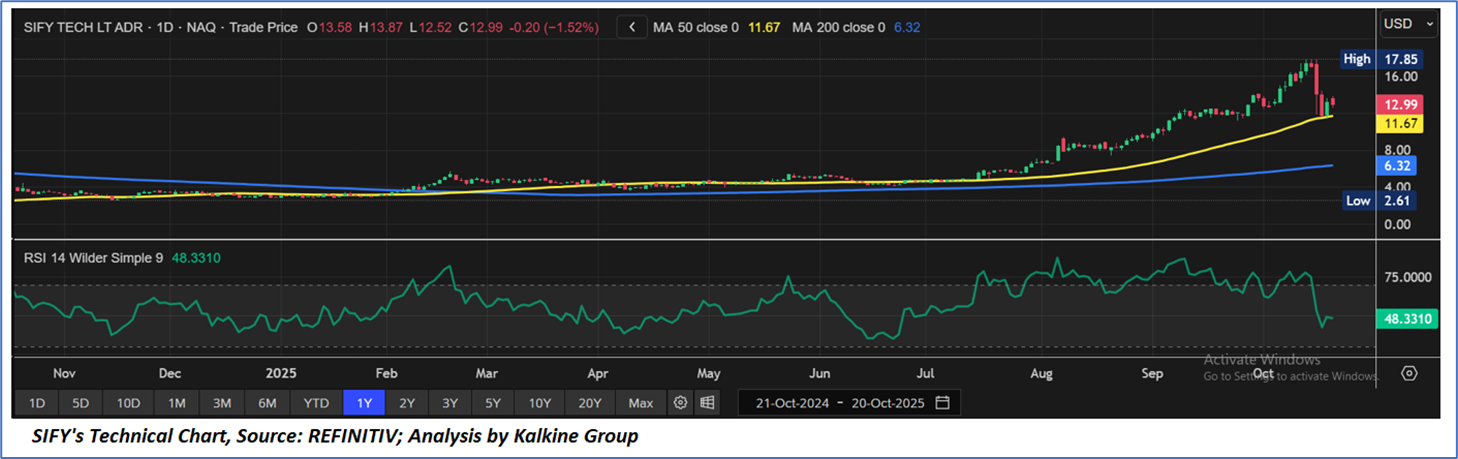
- Trend Overview and Moving Averages Analysis: Sify Technologies Ltd. (NASDAQ: SIFY) trades around USD 12.99, slightly above its 50-day MA of USD 11.67 and well above the 200-day MA of USD 6.32, reflecting a sustained long-term uptrend. The stock recently corrected from a high of USD 17.85, indicating temporary profit booking, but its position above key averages suggest ongoing bullish strength with potential consolidation before recovery.
- Momentum Indicators and Market Strength: The RSI (14) at 48.33 indicates neutral momentum after cooling from overbought levels, implying balanced market sentiment. While selling pressure has eased, a move above 50 could signal renewed buying strength, suggesting that SIFY may be stabilizing after its recent correction phase.
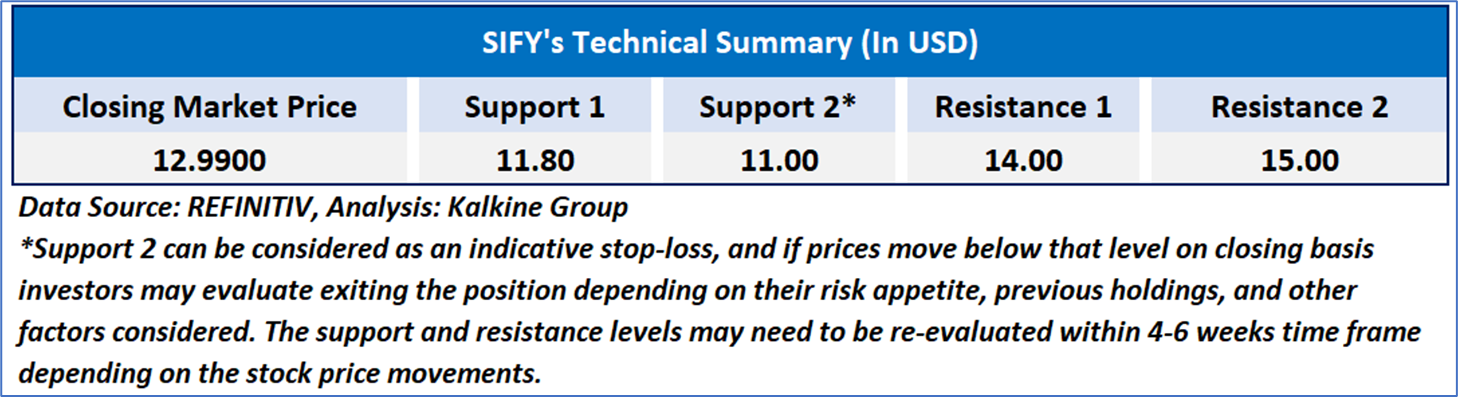
- Technical Outlook and Key Levels: Immediate support lies around USD 11.00–11.50, with resistance near USD 14.50–15.00 and the recent high of USD 17.85. Holding above the 50-day average may trigger recovery, while a drop below USD 11.00 could invite short-term weakness. Overall, stock shows a constructive setup with potential for an upward rebound once consolidation stabilizes.
Sify Technologies Ltd. (NASDAQ: SIFY), a leading Indian digital ICT solutions provider, continues to exhibit steady operational and financial progress, supported by its diversified service mix across Network, Data Center, and Digital segments. In Q1 FY2025–26, the company reported a 14% year-over-year revenue growth and an 18% rise in EBITDA, though near-term losses were recorded due to higher depreciation and interest costs linked to infrastructure expansion. With continued investment in data center capacity, network scalability, and cloud infrastructure, Sify remains well-positioned to capitalize on India’s accelerating digital transformation under initiatives such as Digital India and the India AI Mission. Technically, the stock trades near USD 12.99, holding above key moving averages, indicating a long-term uptrend with temporary consolidation following profit booking. The RSI at 48.33 reflects neutral sentiment, suggesting potential stabilization, with key support near USD 11.00 and resistance around USD 15.00, implying room for recovery once consolidation concludes.
As per the above-mentioned price action, important support near USD 4.00-USD 4.40, momentum in the stock over the last month, and technical indicators analysis, a ‘WATCH’ rating has been given for Sify Technologies Ltd. (NASDAQ: SIFY) at the closing price of USD 12.99, as of October 20, 2025.
Individuals can evaluate the stock based on the support and resistance levels provided in the report in case of keen interest taking into consideration the risk-reward scenario.
Markets are trading in a highly volatile zone currently due to certain macro-economic issues and prevailing geopolitical tensions. Therefore, it is prudent to follow a cautious approach while investing.
Related Risk: This report may be looked at from a high-risk perspective, and a recommendation is provided for a short duration. This report is solely based on technical parameters, and the fundamental performance of the stocks has not been considered in the decision-making process. Other factors which could impact the stock prices include market risks, regulatory risks, interest rates risks, currency risks, social and political instability risks etc.
Note 1: Past performance is not a reliable indicator of future performance.
Note 2: The reference date for all price data, currency, technical indicators, support, and resistance level is October 20, 2025. The reference data in this report has been partly sourced from REFINITIV.
Note 3: Investment decisions should be made depending on an individual's appetite for upside potential, risks, holding duration, and any previous holdings. An 'Exit' from the stock can be considered if the Target Price mentioned as per the Valuation and or the technical levels provided has been achieved and is subject to the factors discussed above.
Note 4: Target Price refers to a price level that the stock is expected to reach as per the relative valuation method and or technical analysis taking into consideration both short-term and long-term scenarios.
Note 5: ‘Kalkine reports are prepared based on the stock prices captured either from the New York Stock Exchange (NYSE), NASDAQ Capital Markets (NASDAQ), and or REFINITIV. Typically, all sources (NYSE, NASDAQ, or REFINITIV) may reflect stock prices with a delay which could be a lag of 15-20 minutes. There can be no assurance that future results or events will be consistent with the information provided in the report. The information is subject to change without any prior notice.

 Please wait processing your request...