JPMorgan Chase & Co
JPMorgan Chase & Co. (NYSE: JPM) is a financial holding company. It has four segments: Consumer & Community Banking (CCB), Corporate & Investment Bank (CIB), Commercial Banking (CB), and Asset & Wealth Management (AWM). CCB segment offers products and services to consumers and small businesses through bank branches, ATMs, digital (including mobile and online) and telephone banking.
Recent Business and Financial Updates
- Revenue and Expense Overview: The firm reported total revenue of USD 43.3 billion for the quarter, with managed revenue of USD 42.7 billion. Operating expenses amounted to USD 22.6 billion, leading to a reported overhead ratio of 53% and a managed overhead ratio of 52%. Credit costs were recorded at USD 3.1 billion, comprising USD 2.1 billion in net charge-offs and a USD 1.0 billion net reserve build. Average loans and deposits showed a 1% year-over-year (YoY) and quarter-over-quarter (QoQ) growth, reflecting the firm's steady business performance.
- Consumer & Community Banking (CCB) Performance: The Consumer & Community Banking (CCB) segment reported a return on equity (ROE) of 29%. While average deposits decreased by 8% YoY and 2% QoQ, client investment assets experienced a significant rise of 21%. Average loans increased by 1% YoY, remaining flat on a quarterly basis. Debit and credit card sales volumes surged by 6%, supported by a 7% increase in active mobile customers, demonstrating the segment's solid growth and customer engagement.
- Corporate & Investment Banking (CIB) Performance: The Corporate & Investment Banking (CIB) division achieved an ROE of 17% for the quarter. Investment banking fees grew by 31% YoY, despite a 4% decline in QoQ, securing the firm’s #1 global ranking in investment banking fees with a 9.1% year-to-date (YTD) market share. Markets revenue rose by 8%, driven by a 27% growth in equity markets, while fixed income markets remained steady. Average banking and payments loans declined by 2% YoY, while average client deposits increased by 7% YoY and 3% QoQ.
- Asset & Wealth Management (AWM) Performance: The Asset & Wealth Management (AWM) division posted a robust ROE of 34%, with assets under management (AUM) reaching USD 3.9 trillion, reflecting a 23% YoY increase. Average loans grew by 2% both YoY and QoQ, while deposits saw a significant rise of 17% YoY, boosted by the allocation of First Republic deposits in the fourth quarter. This segment continues to demonstrate strong asset growth and client engagement.
- CEO's Remarks on Financial Performance: Jamie Dimon, Chairman and CEO, highlighted the firm’s strong financial performance in the third quarter, with a reported net income of USD 12.9 billion and a return on tangible common equity (ROTCE) of 19%. Dimon emphasized the 31% increase in investment banking fees and the 8% rise in markets revenue. He also underscored the firm's position as the top U.S. retail deposits provider for the fourth consecutive year, while card loans grew by 11% and the firm acquired 2.5 million new accounts. Dimon reiterated the firm’s resilience and readiness for potential regulatory changes, noting its robust balance sheet.
- Capital Distribution and Financial Strength: The firm declared a common dividend of USD 3.6 billion, or USD 1.25 per share, and executed USD 6.0 billion in common stock repurchases during the quarter. The net payout over the last twelve months stood at 54%. Book value per share increased by 15%, and tangible book value per share rose by 18%. The firm’s Basel III common equity Tier 1 capital totaled USD 273 billion, with a standardized ratio of 15.3% and an advanced ratio of 15.5%. The supplementary leverage ratio was reported at 6.0%, underscoring the firm’s strong capital position.
- Credit and Capital Support for the Economy: The firm raised over USD 2 trillion in credit and capital year-to-date, including USD 185 billion in credit extended to consumers, USD 30 billion for U.S. small businesses, and USD 1.9 trillion for corporations and non-U.S. government entities. Additionally, USD 50 billion was raised for nonprofit organizations and U.S. government entities such as states, municipalities, hospitals, and universities. This reflects the firm's ongoing commitment to supporting economic growth and serving communities across various sectors.
- Detailed Financial Discussion: Net income for the quarter amounted to USD 12.9 billion, reflecting a 2% decrease, while net revenue grew by 6% to USD 43.3 billion. Net interest income increased by 3%, driven by favorable balance sheet dynamics, higher revolving balances in card services, and higher wholesale deposit balances. Noninterest revenue rose by 11%, supported by asset management fees, investment banking fees, and reduced net investment securities losses. However, operating expenses climbed by 4%, mainly due to higher employee compensation and an increase in headcount. The provision for credit losses was USD 3.1 billion, driven by an increase in net charge-offs and a net reserve build, primarily in card services.
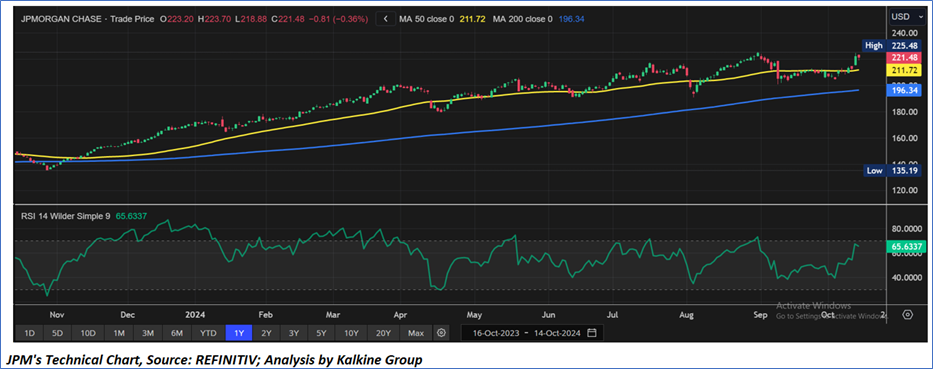
Technical Observation (on the daily chart):
The Relative Strength Index (RSI) over a 14-day period stands at a value of 65.63, currently upward trending, with expectations of a consolidation or an upward momentum if an important resistance of USD220- USD 230.00 is broken. Additionally, the stock's current positioning is above both the 50-period SMA and 200-period SMA, which may serve as dynamic short to medium-term support levels.
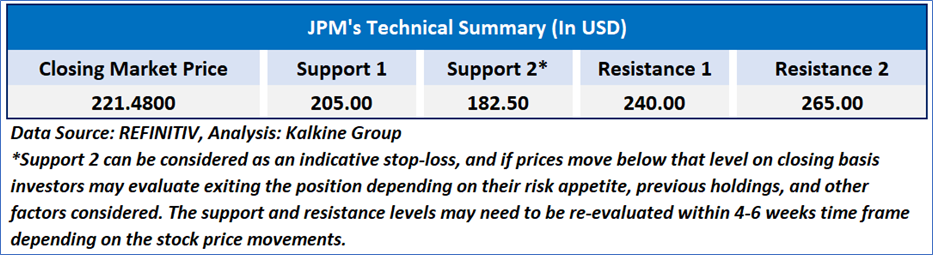
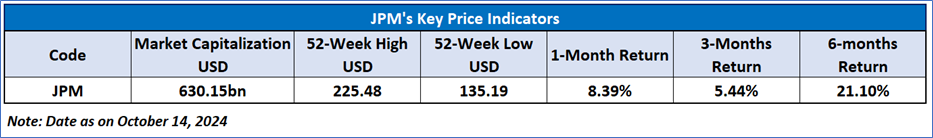
As per the above-mentioned price action, recent key business and financial updates, momentum in the stock over the last month, and technical indicators analysis, a ‘WATCH’ rating has been given to JPMorgan Chase & Co. (NYSE: JPM) at the closing market price of USD 221.48 as of October 14, 2024.
Individuals can evaluate the stock based on the support and resistance levels provided in the report in case of keen interest taking into consideration the risk-reward scenario.
Markets are trading in a highly volatile zone currently due to certain macro-economic issues and prevailing geopolitical tensions. Therefore, it is prudent to follow a cautious approach while investing.
Related Risk: This report may be looked at from a high-risk perspective and a recommendation is provided for a short duration. This report is solely based on technical parameters, and the fundamental performance of the stocks has not been considered in the decision-making process. Other factors which could impact the stock prices include market risks, regulatory risks, interest rates risks, currency risks, social and political instability risks etc.
Note 1: Past performance is not a reliable indicator of future performance.
Note 2: The reference date for all price data, currency, technical indicators, support, and resistance level is October 14, 2024. The reference data in this report has been partly sourced from REFINITIV.
Note 3: Investment decisions should be made depending on an individual's appetite for upside potential, risks, holding duration, and any previous holdings. An 'Exit' from the stock can be considered if the Target Price mentioned as per the Valuation and or the technical levels provided has been achieved and is subject to the factors discussed above.
Note 4: Target Price refers to a price level that the stock is expected to reach as per the relative valuation method and or technical analysis taking into consideration both short-term and long-term scenarios.
Note 5: ‘Kalkine reports are prepared based on the stock prices captured either from the New York Stock Exchange (NYSE), NASDAQ Capital Markets (NASDAQ), and or REFINITIV. Typically, all sources (NYSE, NASDAQ, or REFINITIV) may reflect stock prices with a delay which could be a lag of 15-20 minutes. There can be no assurance that future results or events will be consistent with the information provided in the report. The information is subject to change without any prior notice.

 Please wait processing your request...