
 NZ
 UK
 US
 AU
 IND

 CA

 Share
 X (Formerly Twitter)
 Whatsapp
 Facebook
 LinkedIn
 Telegram
 Email This Article
 Copy Link
 Summarize with AI
 Chat GPT
 Perplexity

Mastercard Incorporated (NYSE: MA) is flat on Thursday after a sharp two-week slide that has taken it from near $600 in late August to the low $550s. As of this chart snapshot (about 30 minutes before the close), shares are trading at $551.81, up $0.34 (+0.06%). The stock opened at $551.00, tested a low of $546.12 and recovered to near the open, leaving a long lower wick. Wednesday's drop pushed price below the 63-day EMA, and today's session is a test of whether buyers will defend this area. I could not find a company-specific catalyst, so the case rests on the chart. 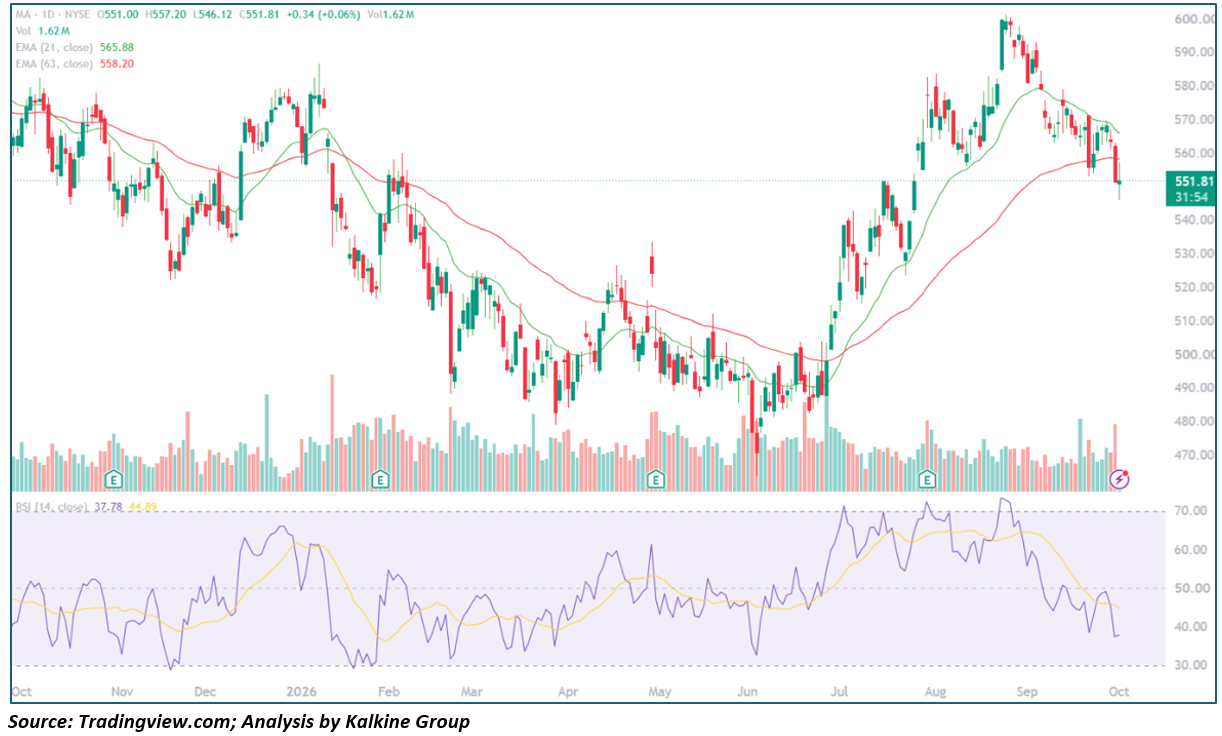
Key Highlights
- Trading at $551.81, up $0.34 (+0.06%), on partial-session Volume of 1.62M shares
- Opened at $551.00, low of $546.12, high of $557.20
- 21-day EMA at $565.88 and 63-day EMA at $558.20, both above price
- 14-day RSI at 37.78, well below its 44.89 signal line
- Resistance at $558.20 and $565.88; support at $546.12 and $540
Trend Structure: Three-Act Pattern
- Range and Decline (October 2025 – June 2026): MA moved sideways between about $520 and $585 through January, then fell sharply in February and March to a low near $488. It kept making lower lows into mid-June, bottoming near $465 to $470.
- Breakout and Peak (late June – August 2026): The stock rallied from the high $400s to about $580 by late July, pulled back to about $525 to $530, and then climbed to a cycle high near $601 in late August.
- Markdown (September – October 2026): Price has fallen about 8% from the high and put in a series of lower highs. Wednesday's drop closed below the 63-day EMA, and today's lower wick shows dip buyers near $546.
Backdrop
The next Earnings report is typically due in late October, so confirm the date. Payment stocks often trade as a group, so sector moves can matter as much as company news.
Moving Averages and Momentum Profile
- Moving Average Stack: The 21-day EMA ($565.88) is above the 63-day EMA ($558.20), so the broader structure is still positive, but price is below both and the 21-day is rolling over.
- Oscillator Behavior: RSI at 37.78 is near oversold territory and well under its signal line. Oversold readings often precede a bounce, though they can persist in a downtrend.
- Volume Behavior: Volume of 1.62M is partial, with the session still open. The red volume bars in late September show active selling.
- Candle Structure: The long lower wick and recovery to the open is a constructive sign, but a doji after a sharp drop needs follow-through to matter.
Key Technical Levels
|
Level |
Type |
Note |
|
$601 |
Resistance |
Late-August cycle high |
|
$580 |
Resistance |
Late-July and early-September highs |
|
$565.88 |
Resistance |
21-day EMA |
|
$558.20 |
Resistance |
63-day EMA |
|
$551.81 |
Reference |
Current price |
|
$546.12 |
Support |
Today's low |
|
$540 |
Support |
Round-number support |
|
$525–$530 |
Support |
Early-August pullback low |
Actionable Technical Outlook
- A close back above the 63-day EMA near $558 would suggest the break was a shakeout and put the 21-day EMA near $566 in view.
- A close below $546 would open $540 and then the $525 to $530 zone.
- The bias is cautiously bearish, with the risk of an oversold bounce. A Reversal candle on higher volume would be the first sign the selling is easing. This is a technical read, not Investment advice.
Metadata
|
Field |
Value |
|
Headline |
Why is Mastercard (NYSE: MA) sitting below its 63-day EMA after a September slide, and is a bounce due? |
|
SEO title |
Mastercard (MA) Slips Below 63-Day EMA: RSI 38 and Key Levels |
|
Meta description |
Mastercard (NYSE: MA) trades at $551.81 below its 63-day EMA. RSI 38, support at $546 and $540, resistance at $558 and $566. |
|
Slug |
why-mastercard-ma-nyse-stock-below-63-day-ema-bounce-levels |
|
Tags |
Mastercard, MA, NYSE, payments, technical analysis, moving averages, oversold |
|
Ticker / Sector |
MA / Financials |
|
Verification status |
PARTIAL (levels read from the chart; catalyst not confirmed) |
|
Data as-of date |
October 1, 2026 (intraday) |


 Nov 06, 2026





 Please wait processing your request...