_10_07_2025_05_33_11_517797.png)
Image source: © 2025 Krish Capital Pty.Ltd
Highlights
- Alphamin Resources’ Q2 2025 revenue reached USD 144.2 million, up 38.8% year-on-year.
- Net income increased to USD 38.0 million, driven by improved margins.
- Interim dividend of CAD 0.07 per share approved, payable September 15, 2025.
Alphamin Resources Corp. (TSXV: AFM) is involved in producing and selling tin concentrate from the Bisie Tin Mine in the Democratic Republic of the Congo (DRC). The company reports a single operating segment, focused on the extraction and sale of tin from this mine.
In Q2 2025, the company reported revenue of USD 144.2 million, up 38.8% from USD 103.9 million in Q2 2024, supported by higher tin sales volumes and stable prices. Gross profit rose to USD 67.3 million, a 31.8% YoY increase from USD 51.1 million, reflecting operating leverage amid cost pressures. Net income increased to USD 38.0 million, compared to USD 22.5 million a year earlier, driven by higher sales and improved margins. Cash flows from operating activities were USD 56.8 million, up 57.0% from USD 36.1 million in the prior-year period.
Business Update
On August 7, 2025, the company announced an interim FY 2025 cash dividend of CAD 0.07 per share, approximately USD 65 million. The dividend is scheduled for payment on September 15, 2025, to shareholders of record as of August 29, 2025.
Outlook
AFM expects to maintain steady tin production following its Q2 2025 restart. Exploration activities are planned to increase in Q3 2025 with additional rigs, which could extend mine life and identify new resources near Bisie. Cash flow generation allows the company to fund growth initiatives while continuing dividend payments. With current tin market conditions and support from new strategic shareholders, the company anticipates stable near-term production and potential long-term output growth.
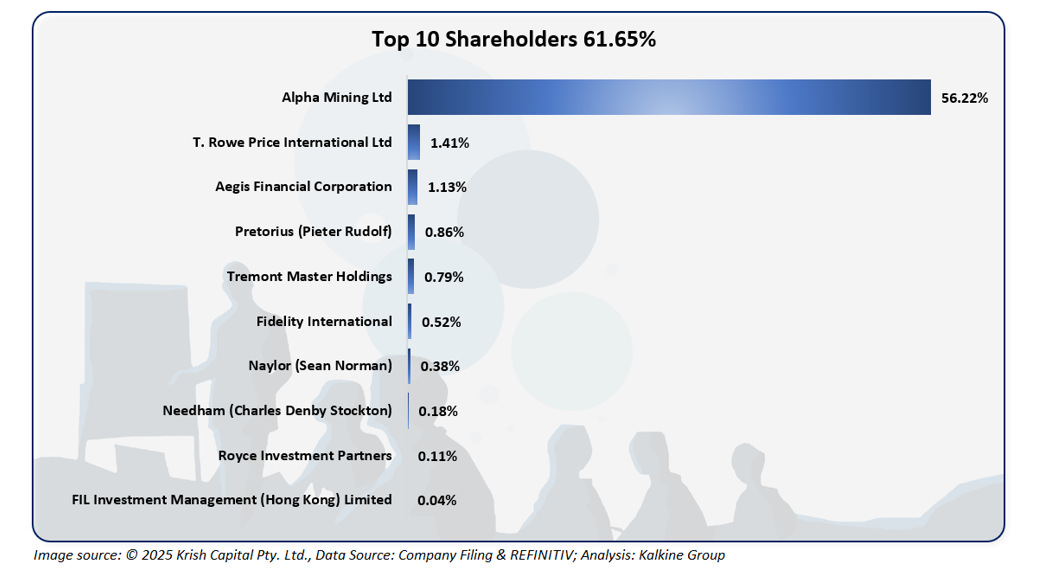
Top 10 Shareholders
The top 10 shareholders of AFM collectively hold approximately 61.65% of the company’s total shares. Among them, Alpha Mining Ltd. is the largest shareholder with around 56.22%, followed by T. Rowe Price International Ltd. with roughly 1.41%.
Stock Information
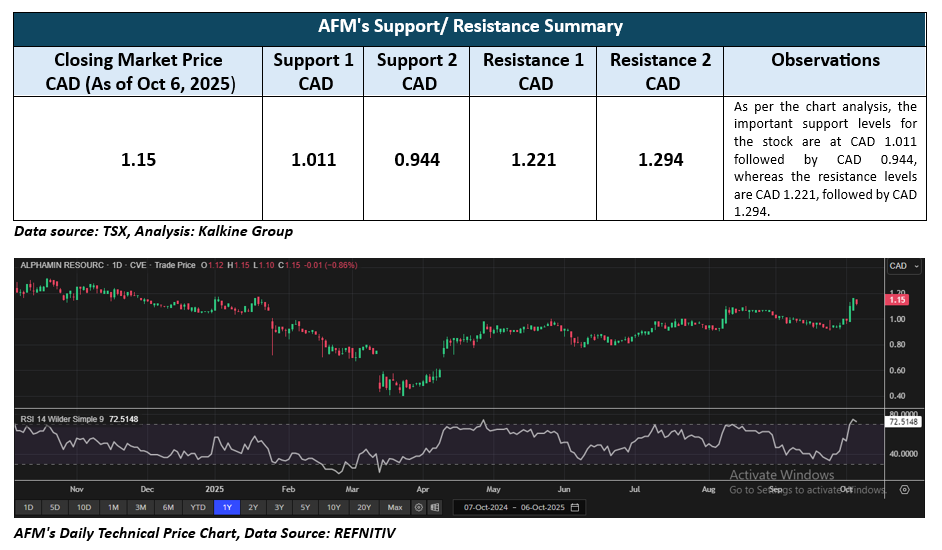
As of the closing price of October 6, 2025 (CAD 1.15), over the past week, the stock gained approximately 21.05%, and about 18.55% over the past month. It is currently trading above the average of its 52-week low of CAD 0.40 and below the 52-week high of CAD 1.32.
Note 1: Past performance is not a reliable indicator of future performance.
Note 2: The reference data for all price data, currency, technical indicators, support, and resistance levels Is October 6, 2025. The reference data in this report has been partly sourced from EODHD/Others.
Technical Indicators Defined
Support: A level at which the stock prices tend to find support if they are falling, and a downtrend may take a pause backed by demand or buying interest. Support 1 refers to the nearby support level for the stock and if the price breaches the level, then Support 2 may act as the crucial support level for the stock.
Resistance: A level at which the stock prices tend to find resistance when they are rising, and an uptrend may take a pause due to profit booking or selling interest. Resistance 1 refers to the nearby resistance level for the stock and if the price surpasses the level, then Resistance 2 may act as the crucial resistance level for the stock.


 Please wait processing your request...