Image source: Shutterstock
Highlights
- AltaGas reported a 4.2% revenue drop in FY24, while normalized net income rose 20.9%
- The company forecasts FY2025 normalized EBITDA of CAD 1.775–1.875 billion and EPS of CAD 2.10–2.30
AltaGas Ltd (TSX: ALA) operates a broad range of energy infrastructure businesses through four main segments: Midstream, Power, Utilities, and Corporate. The company generates revenue from customers in both Canada and the United States, with most of its income coming from U.S.-based clients.
In 2024, AltaGas reported total revenue of CAD 12.4 billion, a 4.2% decrease from the previous year, primarily driven by warmer-than-normal weather impacting its Utilities segment, as well as lower natural gas and LPG commodity prices and reduced Retail Energy contributions.
Normalized EBITDA grew by 12.3% yoy to CAD 1.77 billion, reaching the upper end of its 2024 guidance, underpinned by better performance in both the Utilities and Midstream segments.
Normalized Net Income rose 20.9% yoy to CAD 648 million, supported by disciplined cost control, improved operating margins, and a lower normalized income tax expense. Additionally, normalized Funds from Operations increased 6.3% to CAD 1.19 billion, highlighting continued strength in AltaGas’s cash generation capabilities.
Recent Business Update
The Ridley Island Energy Export Facility (REEF) is advancing in line with project timelines and remains within budget, with an in-service date (ISD) targeted for year-end 2026. In addition, the Pipestone II deep-cut facility is 76% complete and on track for its late 2025 in-service date, strengthening AltaGas’ Montney infrastructure position.
Company Outlook
For 2025, AltaGas projects normalized EBITDA between CAD 1,775 million and CAD 1,875 million, and normalized EPS of CAD 2.10 to CAD 2.30. It also reaffirmed its 5%–6% annual dividend growth target through 2029.
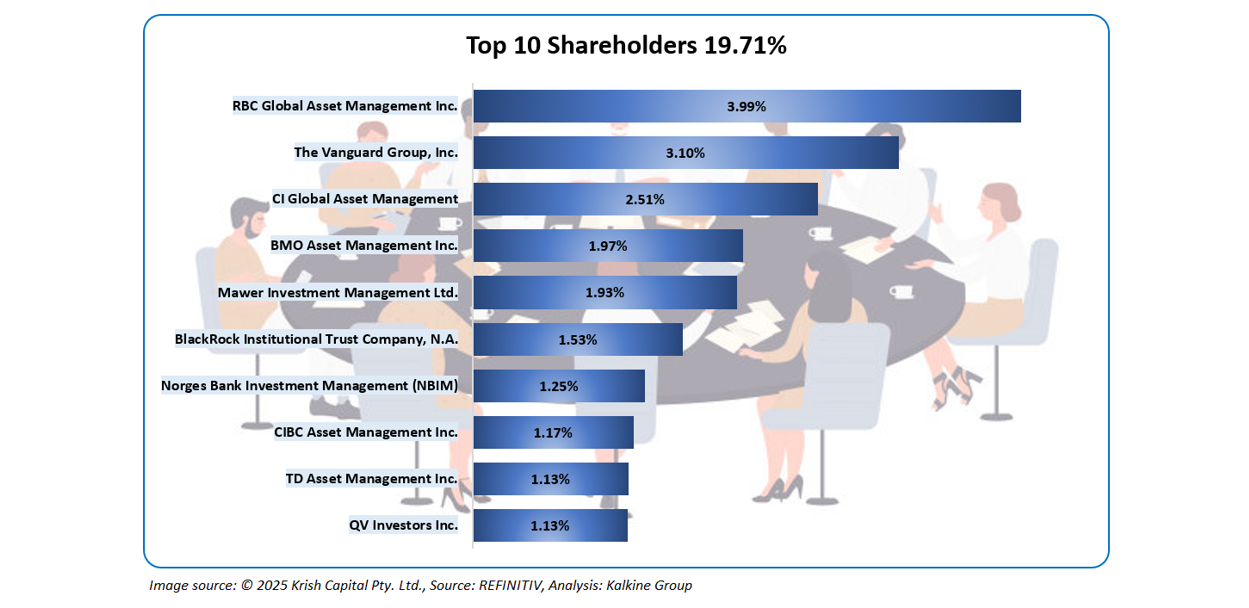
Top 10 Shareholders of ALA
The top 10 shareholders of ALA together form ~19.71% of the total shareholding. RBC Global Asset Management Inc. and Vanguard Group, Inc. hold a maximum stake in the company at ~3.99% and ~3.10%, respectively.
Stock Information
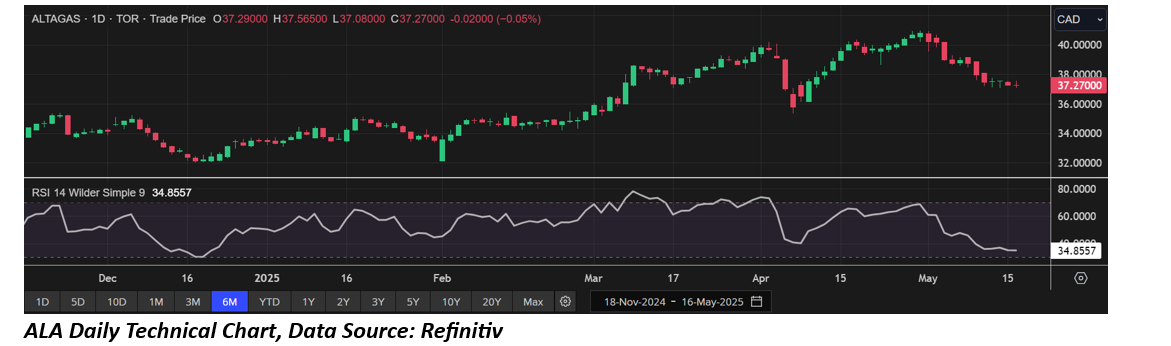
The stock has witnessed a downside of ~0.56% and upside of ~7.49% over the past week and 3 months respectively. Moreover, the stock is trading above the average 52-week high price of CAD 40.98 and the 52-week low price of CAD 29.67, with a closing price of CAD 37.27 as of May 16 2025.
Note 1: Past performance is not a reliable indicator of future performance.
Note 2: The reference data for all price data, currency, technical indicators, support, and resistance levels is May 16. The reference data in this report has been partly sourced from EODHD/Others.
Technical Indicators Defined
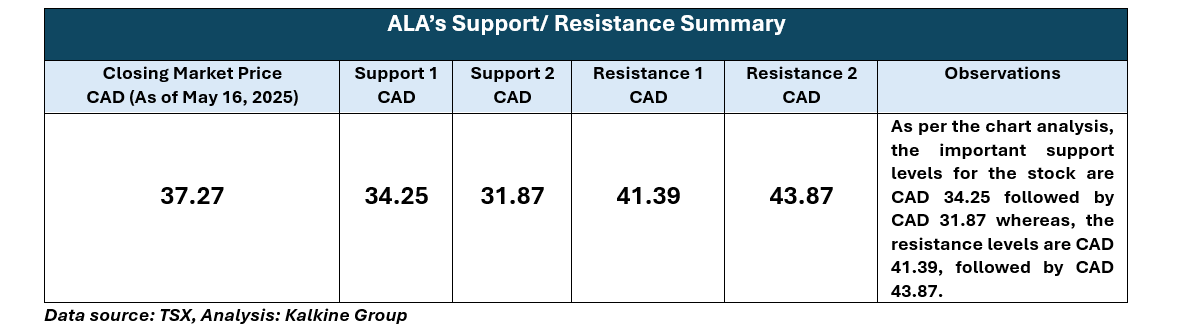
Support: A level at which the stock prices tend to find support if they are falling, and a downtrend may take a pause backed by demand or buying interest. Support 1 refers to the nearby support level for the stock and if the price breaches the level, then Support 2 may act as the crucial support level for the stock.
Resistance: A level at which the stock prices tend to find resistance when they are rising, and an uptrend may take a pause due to profit booking or selling interest. Resistance 1 refers to the nearby resistance level for the stock and if the price surpasses the level, then Resistance 2 may act as the crucial resistance level for the stock.


 Please wait processing your request...