
Highlights
- ATZ’s Q4FY25 retail net revenue increased by 24.2% YoY, while total net revenue increased by 31.1% YoY.
- The company’s gross profit rose by 45.5% YoY to CAD 380.1 million, up from CAD 261.2 million in Q4FY24.
- ATZ’s Q4FY25 net income surged 311.6% YoY to CAD 99.6 million.
Aritzia Inc. (TSX: ATZ) is a Canadian integrated fashion design house offering exclusive apparel and accessories such as blouses, T-shirts, pants, dresses, sweaters, jackets, skirts, shorts, jumpsuits, and more under the Aritzia banner across Canada and the U.S., generating most of its revenue from Retail, followed by eCommerce.
In the fourth quarter of the financial year 2025 (Q4FY25), the company’s retail net revenue increased by 24.2% YoY to CAD 517.1 million, driven by improved boutique performance, successful opening of new flagship stores in the US, and enhanced product assortment.
Net revenue surged by 31.1% YoY to CAD 895.1 million, fueled by double-digit growth in both retail and eCommerce channels, particularly strong US performance, and broad-based comparable sales growth of 26%.
Gross profit rose by 45.5% YoY to CAD 380.1 million, compared to CAD 261.2 million in Q4FY24. Net income increased by 311.6% YoY to CAD 99.6 million due to higher revenue and margin expansion, operating leverage, a lower SG&A ratio, and additional boosts from foreign exchange gains and derivative-related income.
Stock Information
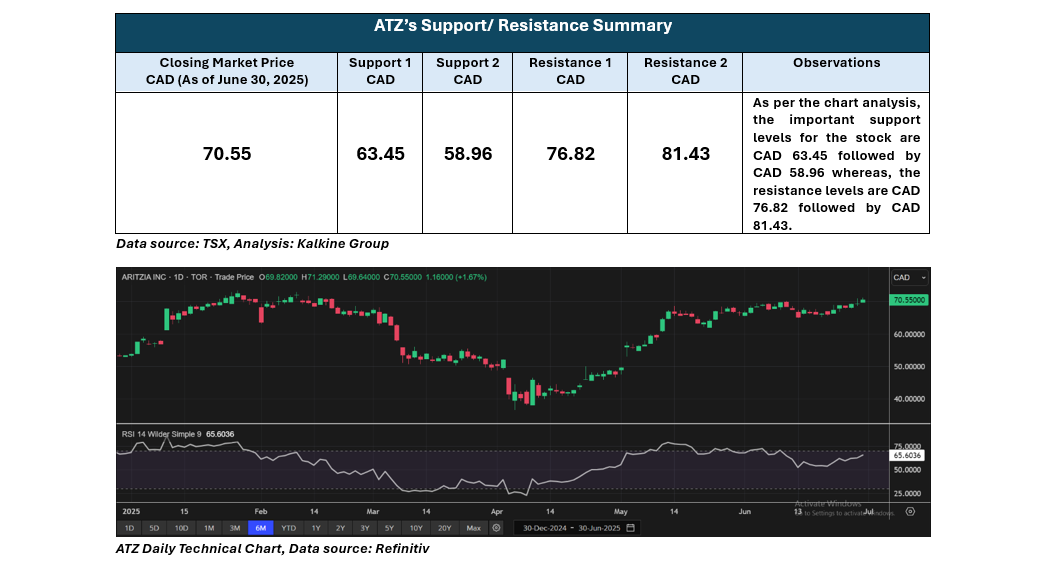
The stock has witnessed an upside of ~4.67% and ~5.90% over the last week and last month, respectively. Moreover, it is trading above the average of 52-week high price of CAD 73.44 and 52-week low price of CAD 36.51, with a closing price of CAD 70.55 as of 30 June 2025.
Note 1: Past performance is not a reliable indicator of future performance.
Note 2: The reference data for all price data, currency, technical indicators, support, and resistance levels is June 30 2025. The reference data in this report has been partly sourced from EODHD/Others.
Technical Indicators Defined
Support: A level at which the stock prices tend to find support if they are falling, and a downtrend may take a pause backed by demand or buying interest. Support 1 refers to the nearby support level for the stock and if the price breaches the level, then Support 2 may act as the crucial support level for the stock.
Resistance: A level at which the stock prices tend to find resistance when they are rising, and an uptrend may take a pause due to profit booking or selling interest. Resistance 1 refers to the nearby resistance level for the stock and if the price surpasses the level, then Resistance 2 may act as the crucial resistance level for the stock.


 Please wait processing your request...