_12_03_2025_01_49_43_849025.png)
Highlights
- Boardwalk REIT posted Q3 2025 rental revenue growth of 4.8% YoY.
- Same-property rental revenue rose 5.1% YoY for Q3, supported by higher occupied rents and reduced incentives.
- Q3 net operating income grew 8.1% YoY, while profit declined 32.1% due to non-operational factors.
- The REIT renewed its NCIB, allowing repurchases of up to 4,018,000 units by November 2026.
Boardwalk Real Estate Investment Trust (TSX:BEI.UN) is a Canadian REIT focused on acquiring, developing, and managing residential multifamily communities across the country.
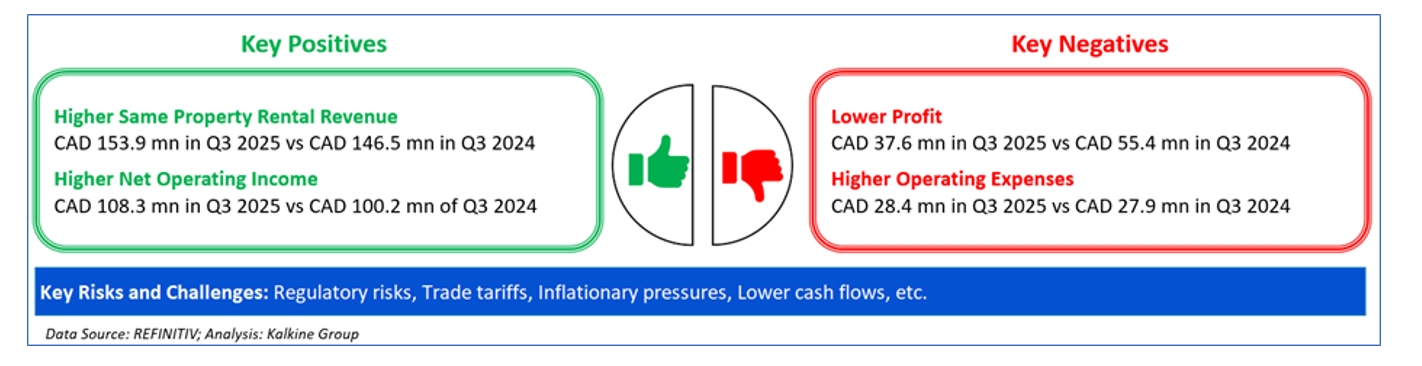
Boardwalk reported rental revenue of CAD 160.8 mn in the third quarter of 2025 (Q3 2025), up 4.8% from CAD 153.4 mn a year earlier. Same-property rental revenue rose 5.1% YoY to 153.9 mn CAD, while net operating income increased 8.1% YoY to CAD 108.3 mn. Profit declined 32.1% YoY to CAD 37.6 mn, reflecting non-operational factors and valuation movements despite steady operating performance. Higher rents, stable demand, improved occupied rents, and reduced leasing incentives supported year-on-year revenue and NOI growth.
Recent Business Update
In November, Boardwalk REIT renewed its NCIB, enabling the Trust to repurchase up to 4,018,000 units, which is about 10% of the public float, by November 2026. The renewal signals management’s ongoing view that the units trade below intrinsic value and supports accretive capital deployment.
Company Outlook
Boardwalk expects continued momentum through the remainder of 2025, supported by demand for multi-family housing and positive leasing spreads. Updated guidance signals visibility on growth, with higher FFO and AFFO per unit ranges and same-property NOI expected to remain in the high-single to low-double-digit zone. Portfolio optimization, disciplined capital deployment and acquisition/disposition activity are expected to enhance earnings quality and NAV traction.
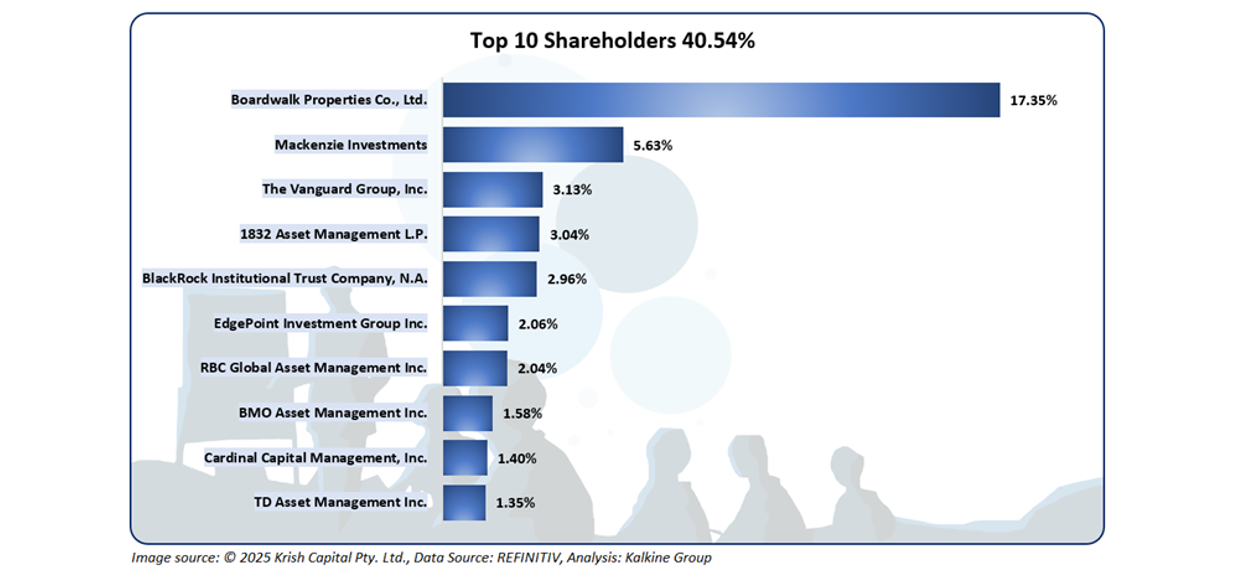
Top 10 Shareholders
The top ten shareholders collectively represent about 40.54% of the company’s total equity. Boardwalk Properties Co., Ltd. and Mackenzie Investments hold the largest stakes at roughly 17.35% and 5.63%, respectively.
Stock Information
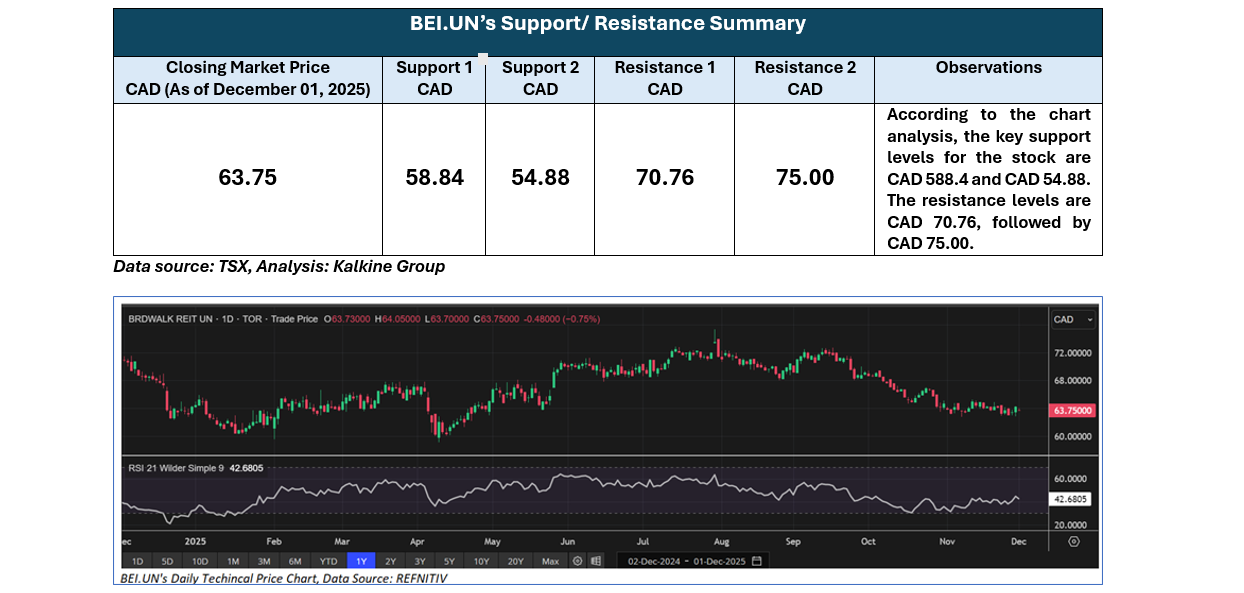
The stock has gained approximately 0.80% over the past week and declined around 8.83% over the last six months. It is currently trading below its 52-week high of CAD 75.37 and 52-week low of CAD 59.10.
Note 1: Past performance is not a reliable indicator of future performance.
Note 2: The reference data for all price data, currency, technical indicators, support, and resistance levels is Dec 01 2025. The reference data in this report has been partly sourced from EODHD/Others.
Technical Indicators Defined
Support: A level at which the stock prices tend to find support if they are falling, and a downtrend may take a pause backed by demand or buying interest. Support 1 refers to the nearby support level for the stock and if the price breaches the level, then Support 2 may act as the crucial support level for the stock.
Resistance: A level at which the stock prices tend to find resistance when they are rising, and an uptrend may take a pause due to profit booking or selling interest. Resistance 1 refers to the nearby resistance level for the stock and if the price surpasses the level, then Resistance 2 may act as the crucial resistance level for the stock.


 Please wait processing your request...