
Image source: Shutterstock
Highlights
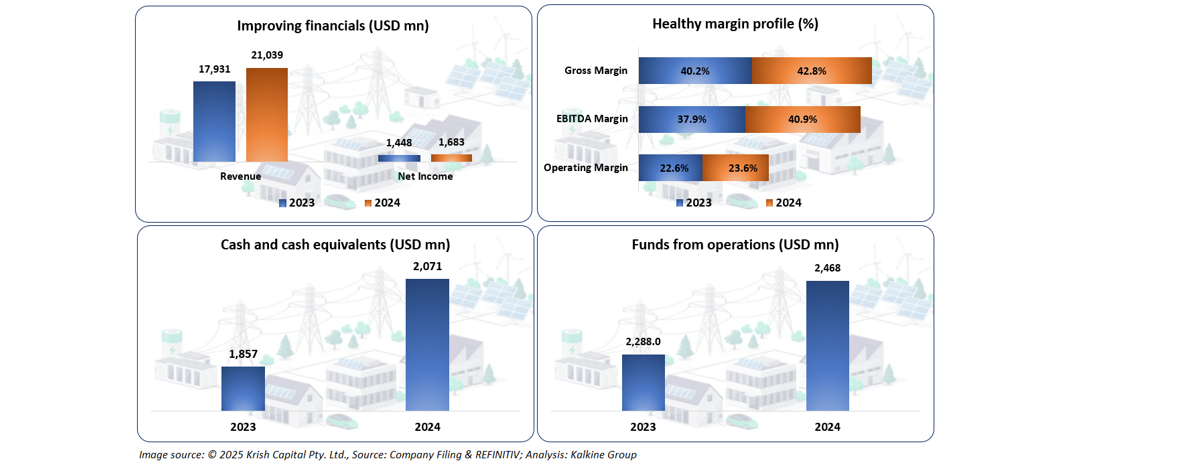
- Brookfield Infrastructure saw a 17.3% YoY revenue growth in FY24, reaching USD 21,039 million
- Gross profit increased by 22.5% YoY to USD 4,958 million in FY24 due to higher revenue and lower general and administrative expenses
- Despite a 3.7% YoY decline in income before tax, net income rose 16.2% YoY to USD 1,683 million in FY24
Brookfield Infrastructure Partners L.P. (TSX:BIP.UN) is a global leader in infrastructure. It owns and operates long-life, high-quality assets in utilities, transport, midstream, and data sectors. These assets are located across the Americas, Asia Pacific, and Europe.
In the financial year 2024 (FY24), the company experienced a notable 17.3% YoY growth in revenue, reaching USD 21,039 million compared to USD 17,931 million in FY23. This increase was driven by higher contributions from all business segments.
Along with the revenue growth, the company reported a 22.5% YoY increase in gross profit, which amounted to USD 4,958 million. This improvement was attributed to the combination of higher revenue and reduced general and administrative expenses, contributing to better cost efficiency.
However, the company’s income before income tax showed a slight decline of 3.7% YoY in FY24, falling to USD 1,953 million from USD 2,029 million in the previous year. This decrease was primarily driven by higher interest expenses, which offset the revenue growth.
On a positive note, the company achieved a 16.2% YoY increase in net income to USD 1,683 million from USD 1,448 million in FY23. The growth in net income was further supported by the recovery of deferred taxes.
The company's financials improved in FY24 compared to FY23, allowing for sequential growth in its margin profile. Furthermore, the company increased cash and cash equivalents as well as funds from operations within the same reporting period.
Recent Business Update
Recently, the company completed the sale of its remaining 25% interest in its U.S. gas pipeline to one of the existing business owners. This divestment marks a full and successful exit from the business, generating over USD 1.7 billion in total proceeds. The transaction has proven highly profitable, delivering an impressive 18% internal rate of return (IRR) and a 3x multiple on capital since the company’s recapitalization in 2015.
Company Outlook
The company is confident that its semiconductor manufacturing facilities in the United States are strategically positioned to benefit from the positive outlook in the semiconductor market. This investment is expected to drive stable growth, further strengthening its capital backlog and contributing to long-term success.
Top 10 Shareholders
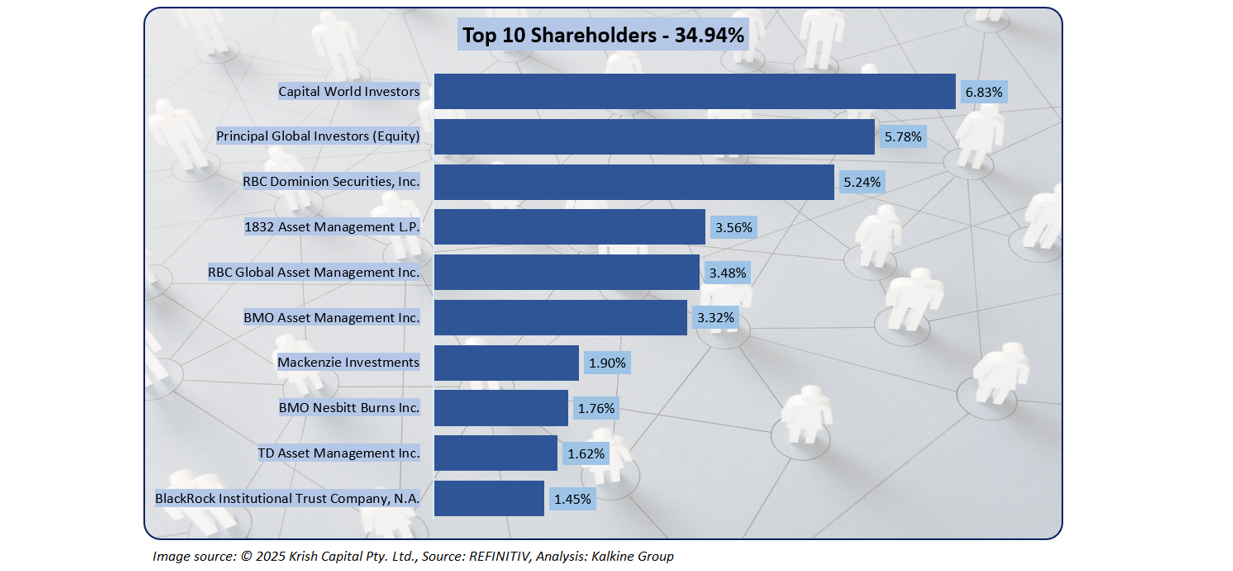
The top 10 shareholders of Brookfield collectively own approximately 34.94% of the company’s total shares. Capital World Investors and Principal Global Investors (Equity) are the largest stakeholders, holding around 6.83% and 5.78%, respectively.
Stock Information
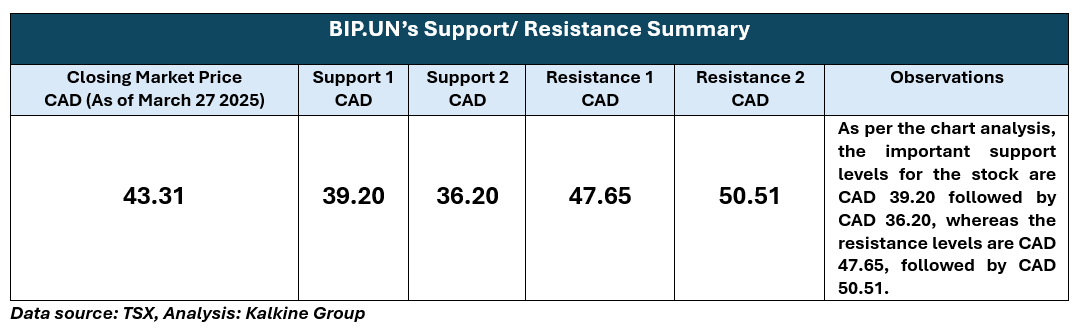
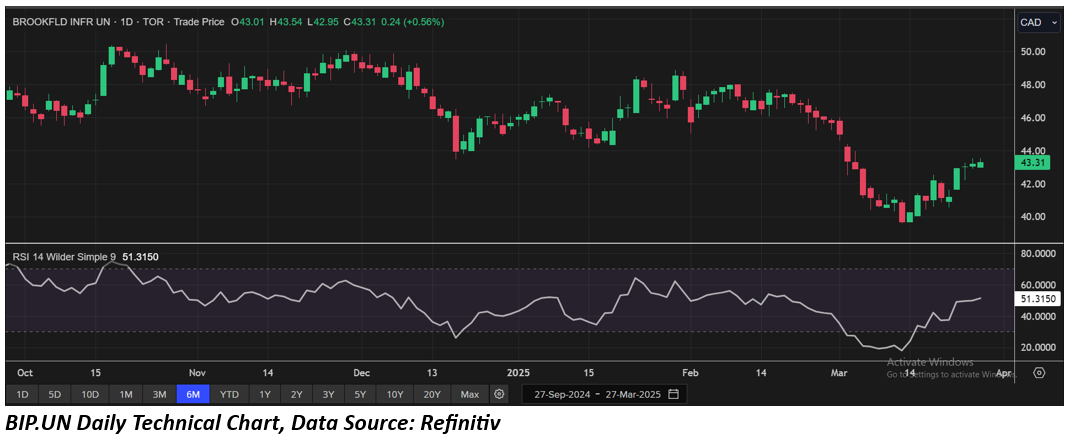
The stock has experienced a notable upside of approximately 5.22% over the past week while seeing a downside of about 6.53% over the last month. Currently, it is trading above the average of its 52-week high price of CAD 50.46 and its 52-week low price of CAD 34.36, with a closing price of CAD 43.31 as of March 27, 2025.
Note 1: Past performance is not a reliable indicator of future performance.
Note 2: The reference data for all price data, currency, technical indicators, support, and resistance levels is March 27 2025. The reference data in this report has been partly sourced from EODHD/Others.
Technical Indicators Defined
Support: A level at which the stock prices tend to find support if they are falling, and a downtrend may take a pause backed by demand or buying interest. Support 1 refers to the nearby support level for the stock and if the price breaches the level, then Support 2 may act as the crucial support level for the stock.
Resistance: A level at which the stock prices tend to find resistance when they are rising, and an uptrend may take a pause due to profit booking or selling interest. Resistance 1 refers to the nearby resistance level for the stock and if the price surpasses the level, then Resistance 2 may act as the crucial resistance level for the stock.


 Please wait processing your request...